
October’s Crypto Earthquake: Unpacking the $400 Billion Flash Crash and the Dawn of New Narratives
October witnessed a dramatic and unexpected reversal in the cryptocurrency market. Despite the Federal Reserve’s interest rate cuts, which typically buoy risk assets, the crypto sphere experienced a staggering $400 billion flash crash. This market turbulence wasn’t merely a reaction to macroeconomic policy; it exposed a critical internal vulnerability: high leverage meeting thin liquidity, particularly when confronted by external shocks like the threat of new tariffs. Yet, beneath the rubble of price volatility, a compelling new story is unfolding. Innovative narratives such as AI+Crypto convergence, Real-World Assets (RWA) tokenization, and burgeoning prediction markets are quietly gaining traction, laying the groundwork for the next market upturn. This article delves beyond the surface-level price movements to reveal the true causes of this liquidity crisis and pinpoint the burgeoning opportunities that lie ahead.
1. The Macroeconomic Paradox: Fed Cuts and Market Shockwaves
On October 30th, the Federal Reserve executed its second rate cut of the year, lowering the federal funds rate target range to 3.75%-4.00%. This decision was a direct response to a unique dilemma facing the U.S. economy: the dual threat of rising inflationary pressures and a decelerating job market. Fed Chair Jerome Powell candidly admitted, “There is no risk-free path,” underscoring the immense complexity and uncertainty surrounding the Fed’s policy trajectory.
The market’s reaction to the rate cut was counterintuitive. While rate reductions are generally expected to stimulate risk assets, the cryptocurrency market experienced a significant sell-off throughout October. This suggests that investors had largely priced in the anticipated rate cuts, leading to widespread profit-taking once the actual announcement was made.
(1) Federal Funds Rate: A Shift Driven by Employment Concerns
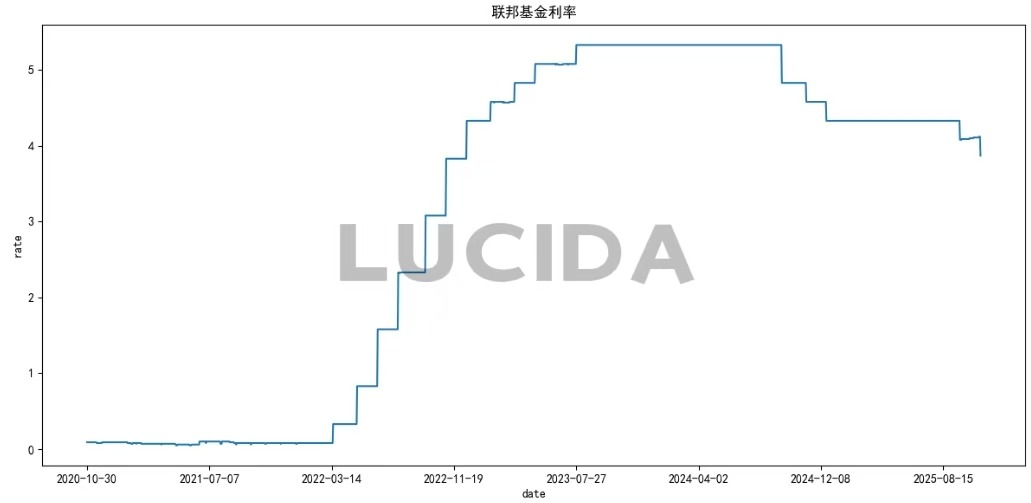
The Fed’s 25-basis-point rate cut in October largely aligned with market expectations. A primary driver behind this decision was a noticeable slowdown in the employment market. The official policy statement notably removed the phrase “labor market conditions remain strong,” replacing it with an emphasis on “slowing employment growth and a slight rise in the unemployment rate.” This linguistic shift signaled the Fed’s increasing concern over the health of the job market.
(2) The Fed’s Balance Sheet Pivot: From QT to “Implicit Easing”
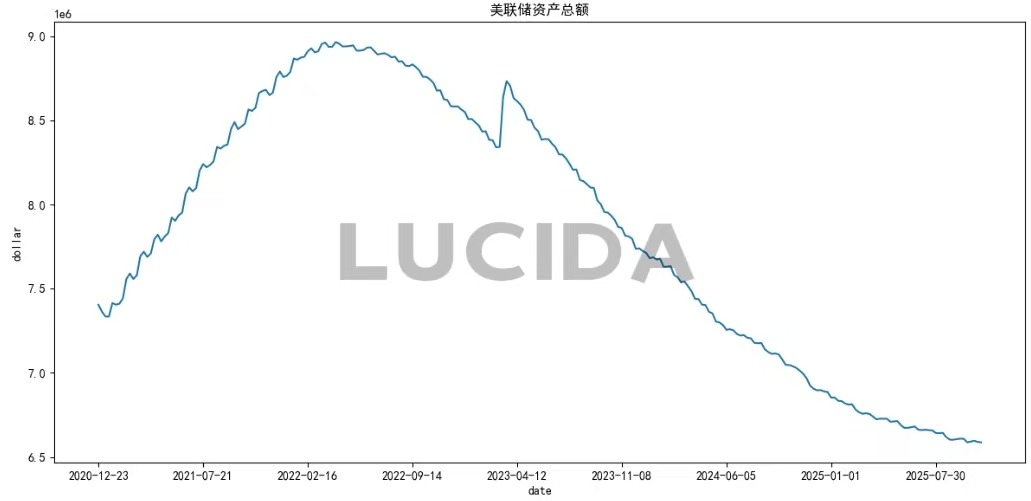
Beyond the rate cut, the Federal Reserve made another pivotal announcement on October 30th: it would cease its balance sheet reduction (Quantitative Tightening, or QT) program starting December 1st. This means the monthly reduction of $5 billion in U.S. Treasuries and $35 billion in mortgage-backed securities (MBS) will conclude. Chair Powell justified this by citing “money market pressures demanding immediate adjustments to balance sheet operations” and acknowledging “clear signs” that it was time to halt QT.
Ostensibly, this policy reversal addresses tightening liquidity in money markets, evidenced by the sharp drop in the overnight reverse repurchase (ON RRP) facility usage and bank reserve ratios hovering near a critical 12.2%. However, a deeper implication is the Fed’s struggle with monetary policy under immense national debt constraints. With U.S. federal government debt surpassing $38 trillion and net interest expenses nearing defense spending, continued QT, while inflation-suppressing, would significantly escalate government borrowing costs, potentially triggering a debt crisis. Thus, halting QT represents a precarious balancing act between inflation control and debt sustainability.
Looking ahead, the Fed’s balance sheet trajectory appears to be “stop shrinking, then expand.” Powell explicitly stated post-October meeting that “eventually the Fed will expand its balance sheet again,” citing the need for increased reserves to support a functioning economy and banking system. This suggests that after a period of stability post-December 1st, the Fed might resume asset purchases, likely with a greater focus on short-term Treasuries to reduce overall asset duration.
These shifts carry profound market implications. Halting QT is widely considered “implicit easing,” as it ceases to withdraw liquidity from the market, potentially injecting new capital into the financial system. Some analysts estimate this measure could have an easing effect equivalent to a 25-basis-point rate cut. Historically, marginal changes in the Fed’s balance sheet significantly impact real yields, dollar flows, and risk appetite. Should liquidity conditions genuinely improve, highly liquidity-sensitive “peripheral risk assets” like Bitcoin and other cryptocurrencies could find renewed valuation support.
(3) US September Core PCE Price Index: Inflationary Headwinds Persist
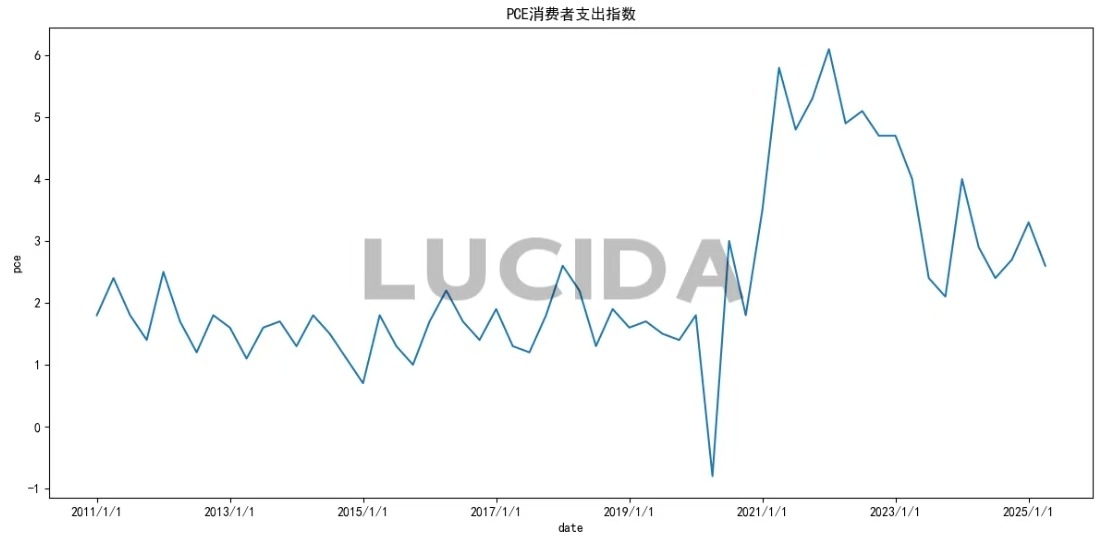
Due to a U.S. government shutdown, October’s Core PCE data was not released. However, the September PCE Price Index, the Fed’s preferred inflation gauge, showed a 2.7% year-over-year increase, slightly up from July’s 2.6%, and a 0.3% quarter-over-quarter rise, accelerating by 0.1 percentage point from July. The more closely watched Core PCE (excluding food and energy) grew 0.2% quarter-over-quarter and 2.9% year-over-year, consistent with July. Service prices, particularly airfares, hotel accommodations, financial services, insurance, housing, and utilities, saw a 0.3% increase. Goods prices edged up 0.1%, with declines in recreational goods and vehicles offset by slight increases in other durable manufactured goods and gasoline. The Fed views tariffs’ impact on inflation as relatively mild, contributing approximately 0.3%-0.4% to Core PCE with slow transmission. Powell noted, “In the short term, the risks to inflation are skewed to the upside, while the risks to employment are skewed to the downside – a challenging situation.”
(4) US Dollar Index: Resilience Amidst Policy Divergence
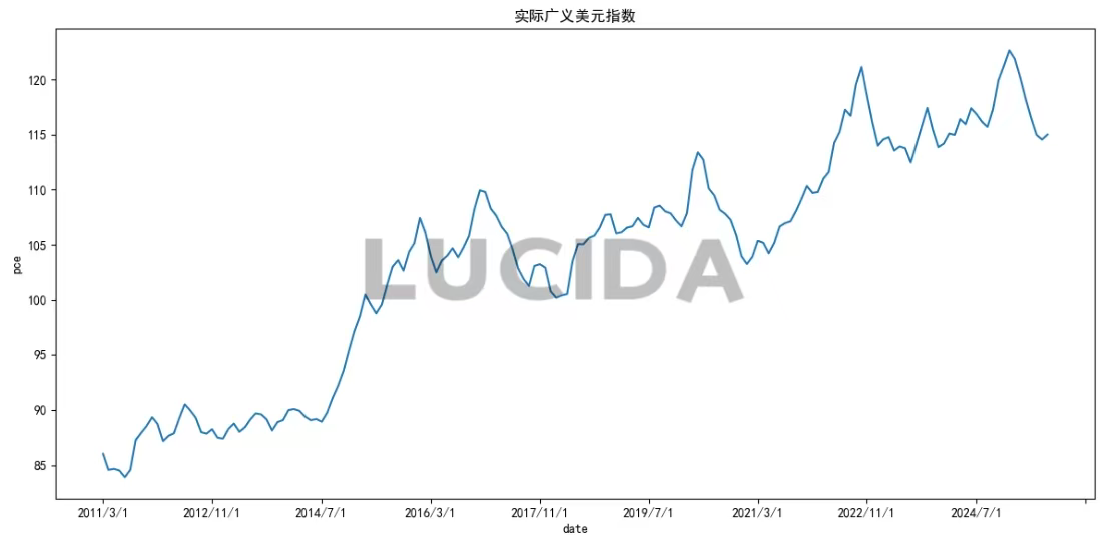
The U.S. Dollar Index (DXY) initially weakened post-Fed rate cut but failed to sustain a decline. This resilience was largely due to the continued dovish monetary policies of the European Central Bank and the Bank of Japan, which limited the dollar’s potential for significant depreciation. Furthermore, soaring long-term U.S. Treasury yields (with the 10-year yield rising to 4.145%) continued to attract safe-haven capital back to the U.S., further undermining any substantial downward pressure on the dollar.
Summary: A Fed Navigating “In the Fog”
The October rate cut was a decision born from the Fed’s triple dilemma. Weakening employment emerged as the critical trigger. The decision itself faced rare internal dissent, with one Federal Reserve Bank president opposing the cut and another advocating for a larger 50-basis-point reduction. This divergence underscores the Fed’s difficult balancing act between inflation and growth. Powell aptly described the current economic outlook as “driving in fog,” emphasizing the profound uncertainty of the policy path. Despite the Fed’s persistent signals of easing, the digital asset market reacted coolly. Bitcoin, for instance, saw a nearly 5% decline in October, breaking a six-year streak of “Uptober” gains. This disconnect reveals market skepticism: when rate cuts stem from economic anxieties rather than robust growth, risk assets struggle to find sustained momentum.
2. Decoding Crypto’s October Sentiment Rollercoaster
(1) Total Market Capitalization: A Volatile Journey
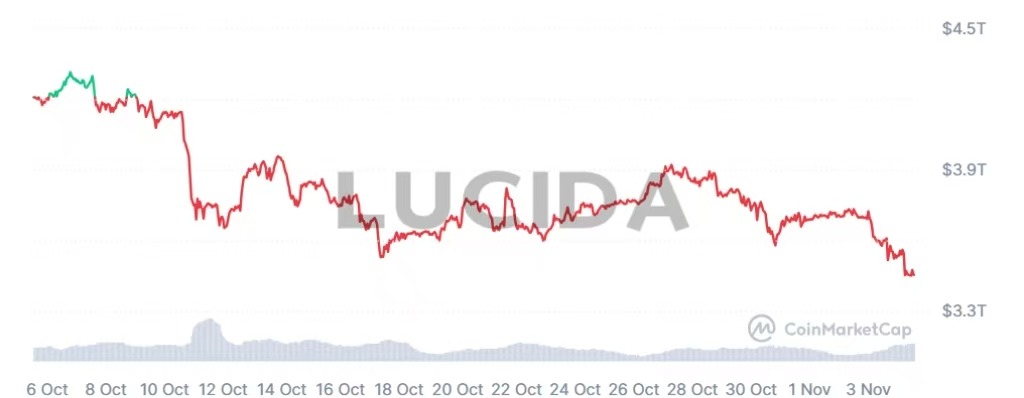
Total market capitalization serves as the ultimate barometer of market sentiment and overall health. Its fluctuations are a composite of individual token price changes, capital flows, and collective market confidence. October saw a “rollercoaster” ride: on October 5th, propelled by strong performances from Bitcoin and Ethereum, the total market cap briefly reached a new historical high of $4.35 trillion. However, the “10.11” crash delivered a single-day drop exceeding 9%, wiping out significant value. By the end of October, the total market cap had retreated to approximately $3.4 trillion, a dramatic ebb and flow that vividly illustrates the severe wealth contraction during periods of market panic and deleveraging.
(2) Altcoin Season Index: A Swift Shift to Bitcoin Dominance
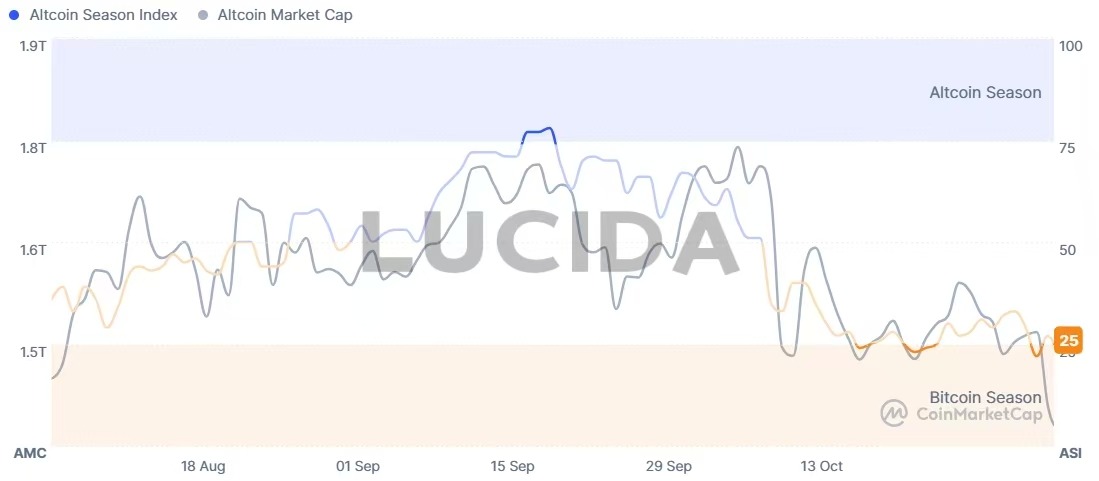
The core logic of the Altcoin Season Index is to measure how many major altcoins outperform Bitcoin over a specific period. When the index falls below 75, especially into the 20-30 range (signifying “Bitcoin Season”), it indicates that capital is flowing out of higher-risk altcoins and into the more stable Bitcoin. This typically characterizes periods of market de-risking or the early stages of a bull market. This trend was evident by the end of October, when the index stood at 32, confirming a market shift into a risk-off mode.
Earlier in October, the index had briefly touched 78, clearly signaling an “Altcoin Season.” This rapid transition from “Altcoin Season” to “Bitcoin Season” starkly revealed the shifting focus of market attention. Historically, a strong rebound of the index from low levels (e.g., 15 or 17) to above 30 can often foreshadow the beginning of capital rotation, serving as an early signal to observe and gradually position in altcoins. However, investors must remain vigilant, as altcoin cycles are generally shorter and more volatile than Bitcoin cycles.
(3) Fear & Greed Index: Plunging into “Extreme Fear”
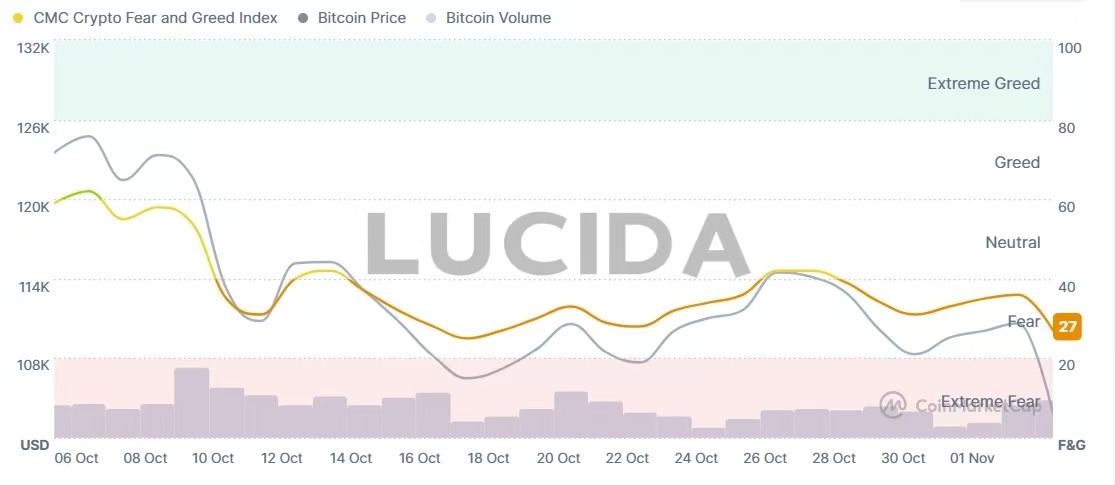
The Crypto Fear & Greed Index experienced a dramatic swing from “Greed” to “Extreme Fear” between October and early November. On October 5th, the index reached a “Greed” high of 74, coinciding with Bitcoin prices nearing their all-time peak. However, as the market plunged due to macroeconomic concerns (such as the threat of Trump’s tariffs) and internal structural risks (like high-leverage liquidations), the index plummeted to 21 by November 4th, entering the “Extreme Fear” zone. This extreme emotional reversal not only reflects the fragility of investor confidence but often serves as a contrarian indicator for identifying short-term oversold conditions or potential rebound opportunities—some analysts believe such intense market anxiety could signal the formation of a temporary bottom. Furthermore, during October’s crash, Bitcoin dominance rose, while overall market trading volume and social sentiment declined across the board, collectively pushing sentiment firmly into the “fear” territory.
3. Beneath the Surface: Where Capital and Innovation Converge
Despite the overall market downturn, capital and interest haven’t evaporated; instead, they’ve strategically repositioned within key sectors, demonstrating significant structural differentiation. A stark contrast between institutional capital flows and community-driven fervor paints a diverse picture of the current market landscape.
(1) Institutional Anchors: Steady Capital Flows into Core Narratives
Amidst volatility, institutional capital displayed clear preferences. Bitcoin and Ethereum spot ETFs recorded net inflows of $5.55 billion and $1.01 billion, respectively, signaling unwavering long-term confidence. Crucially, the total stablecoin supply in circulation increased by $9.38 billion, indicating substantial off-chain capital awaiting opportune entry points. These steady funds primarily gravitated towards several core narrative sectors:
- AI + Crypto Convergence: This powerful fusion is deepening, primarily centered around the struggle for “computing power, data, and AI agent ownership.” Standards like ERC-8004 are enabling the tokenization of AI agents, while Coinbase’s x402 protocol is building an open payment channel for inter-agent transactions.
- Real-World Assets (RWA): RWA tokenization is experiencing explosive growth. The volume of tokenized U.S. Treasuries surged from $800 million to over $7.3 billion, predominantly led by traditional finance giants like BlackRock (with its BUIDL fund) and Franklin Templeton.
- Prediction Markets: Interest in prediction markets continues to soar, with platforms like Polymarket and Kalshi witnessing nearly a fivefold increase in trading volume. The parent company of the New York Stock Exchange’s plan for an investment of up to $2 billion further propels this sector toward mainstream adoption.
(2) Technological Frontiers and Regulatory Catalysts
While institutional capital anchors mainstream sectors, technological advancements and regulatory evolution are simultaneously fostering new opportunities:
- Privacy Technology: Competition in the privacy domain is intensifying, with Trusted Execution Environments (TEE), Zero-Knowledge Proofs (ZKP), and Fully Homomorphic Encryption (FHE) vying for future standard dominance.
- Yield-Generating Protocols: These have emerged as new darlings, with DeFi protocols generating approximately $600 million in fees in September. Hyperliquid, for instance, allocated 95% of its revenue over the past 30 days to token buybacks and holder rewards.
- Crypto-Native Banks and Stablecoins: The passage of the GENIUS Act has marked a turning point for these entities. Stablecoin payment volumes grew by approximately 70%, directly demonstrating how regulatory clarity can accelerate application adoption.
(3) Community Enthusiasm: The Meme Coin Counter-Trend Carnival
In stark contrast to institutional rationality, the meme coin market witnessed a fervent, counter-trend carnival. Projects like BALZ rapidly gained traction on the BNB Chain, raising over $2 million and attracting more than 40,000 community members within days. Chinese meme coins soared in popularity across the Binance, Solana, and Base ecosystems. While phenomena like “Binance Life” saw short-term market cap explosions and attracted a flood of new traders, they also highlighted the inherent limitations of their long-term sustainability.
This bifurcated landscape clearly illustrates the current market’s complexity: institutional capital is strategically positioning in core sectors with long-term value, while community enthusiasm seeks short-term explosive opportunities in the meme coin space. These two parallel narratives collectively formed the complete picture of the October market.
4. The Evolving Global Regulatory Compass: East-West Divergence
On the global regulatory frontier, a distinct East-West divergence in policy approaches towards cryptocurrencies is becoming increasingly apparent.
The United Kingdom has adopted a more accommodating stance, opening the London Stock Exchange to digital assets and lifting a four-year ban on cryptocurrency exchange-traded notes (ETNs). Analysts project this move could lead to a 20% growth in the UK’s crypto market, signaling a proactive embrace of digital innovation.
Conversely, China maintains a firm restrictive approach. People’s Bank of China Governor Pan Gongsheng stated at the 2025 Financial Street Forum Annual Conference that “the People’s Bank will continue to crack down on digital currency speculation, maintain financial order, and dynamically track the development of overseas stablecoins.”
Meanwhile, the U.S. regulatory landscape witnessed a significant breakthrough. The SEC approved the Hashdex Nasdaq Crypto Index US ETF to operate under new general listing standards, allowing it to hold XRP, SOL, and XLM in addition to BTC and ETH. This landmark decision paves the way for a more diversified range of crypto ETF products, potentially reshaping the institutional capital allocation landscape within the United States.
5. Navigating the Future: Strategic Insights for the Next Cycle
Looking ahead, the digital asset market finds itself at a critical juncture, transitioning between old and new narratives.
The Federal Reserve’s future policy path will hinge on a delicate balance: the extent of the job market slowdown versus the sustainability of inflation’s retreat. Standard Chartered Bank forecasts a slight rebound of the U.S. Dollar Index to 100 within the next 1-3 months.
From a market structure perspective, while October’s flash crash was painful, it served as a necessary deleveraging process. Data indicates that open interest decreased from $4.87 billion to $4.51 billion following the event, and funding rates dropped by 51%. A market driven by conviction and institutional capital seeking new allocation opportunities is steadily forming. Technological innovation will continue to be the primary driver of market development. Narratives such as AI agents, prediction markets, and RWA not only represent the technological frontier but also dictate the direction of capital flows. Against a backdrop of sluggish traditional economic growth, these sectors are poised to become the vanguards of market recovery over the next six months.
(The above content is an excerpt and reproduction authorized by our partner PANews. Original Link | Source: Lucida & Falcon)
Disclaimer: This article is for market information purposes only. All content and views are for reference only and do not constitute investment advice. They do not represent the views and positions of BlockTempo. Investors should make their own decisions and trades. The author and BlockTempo will not bear any responsibility for direct or indirect losses resulting from investor transactions.