
Authored by: 0xWeilan
As the prospect of interest rate cuts faces renewed uncertainty and risk appetite remains subdued, cyclical selling—a manifestation of the “cycle law”—has emerged as the primary driver of Bitcoin’s (BTC) recent performance. Without robust economic and employment data to foster a shift in risk sentiment and catalyze capital inflows, coupled with persistent selling from long-term holders, a decisive breach of BTC’s bull-bear demarcation line could trigger a “multi-kill” stampede, significantly elevating the probability of the current BTC cycle concluding.
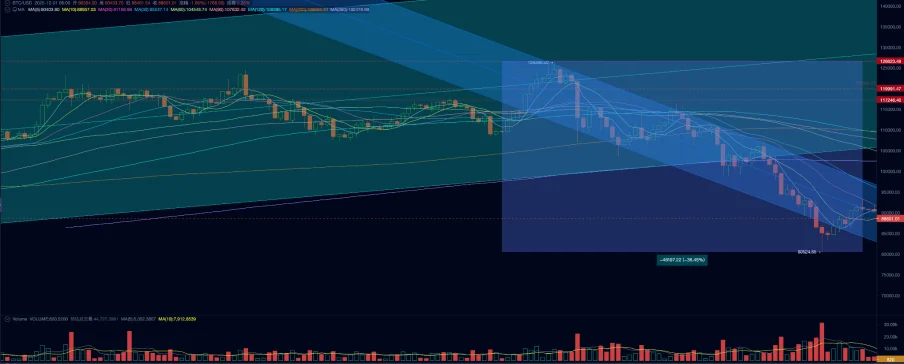
Indeed, November saw BTC succumb to the “multi-kill” stampede forewarned in our October report, plummeting by 17.51% in a single month. This marked the second-largest monthly decline of the current cycle. By month-end, BTC’s maximum drawdown from its peak reached an unprecedented 36.45% for this cycle.
From a technical perspective, BTC momentarily breached the critical “Trump bottom” support zone, defined by the $90,000-$110,000 range, and traded below its 360-day moving average for three consecutive weeks. This movement effectively confirmed a “bull-to-bear” transition on a daily timeframe, with weekly confirmation actively unfolding. The ultimate monthly confirmation, however, remains to be seen.
The confluence of short-term liquidity strain, exacerbated by the US government shutdown, and the erratic “rollercoaster” swings in Federal Reserve rate cut expectations—fueled by mixed economic and employment data—created an environment of anticipated mid-term liquidity tightening. This triggered a large-scale divestment and hedging of high-beta assets by global capital, alongside inherent cyclical movements within the cryptocurrency market. These factors represent the fundamental drivers behind the extreme market volatility observed in BTC and the broader crypto ecosystem. The unpredictable nature of macroeconomic liquidity further complicates the critical assessment of whether the cryptocurrency market is transitioning from an “old cycle to a new one.”
In this comprehensive report, EMC Labs leverages its proprietary “BTC Cycle Multi-factor Analysis Model” to deliver a structured analysis of November’s market dynamics. Our aim is to unravel the underlying logic and trajectory of the decline, offering a nuanced assessment of the mid-to-long-term outlook, specifically discerning between a “mid-term correction” and a definitive “transition into a bear market.”
The Liquidity Crisis: Exhaustion and Unpredictability
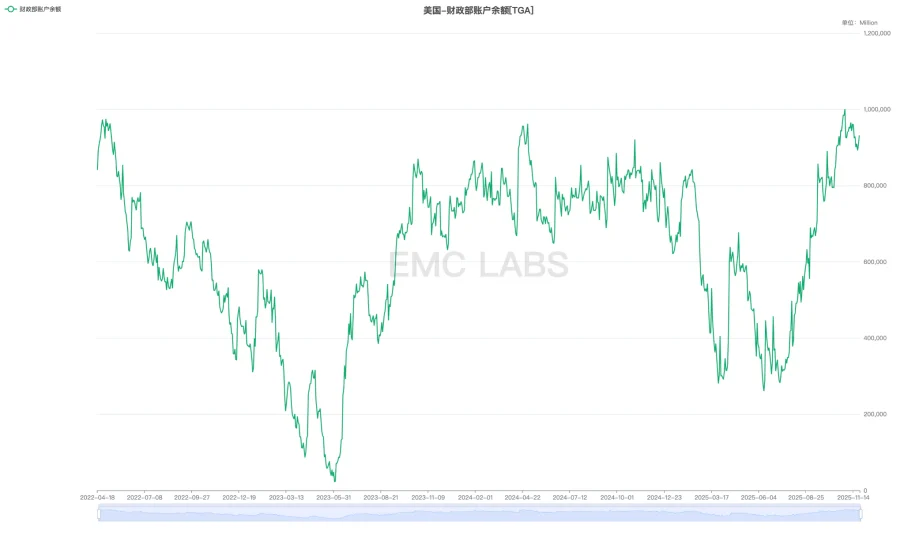
By November 12, the US government shutdown had extended for an unprecedented 43 days. During this period, while fiscal expenditures were severely curtailed, revenues from taxes and tariffs continued to flow in. This created a significant accumulation of cash, effectively a “receipts-only” scenario, which directly inflated the US Treasury General Account (TGA) balance held at the Federal Reserve. This mechanism acted as a powerful “liquidity drain” from the broader market.
The TGA balance surged by over $200 billion in a single month, nearing $1 trillion. This massive accumulation effectively siphoned off bank reserves from the private sector, creating a pronounced “liquidity vacuum.” Consequently, bank reserves plummeted from approximately $3.3 trillion to about $2.8 trillion, approaching what the market perceives as the lower threshold for “ample reserves.” This acute shortage was further evidenced by the Overnight Reverse Repurchase Rate (ON RRP Rate) and the Secured Overnight Financing Rate (SOFR) consistently trading above the Interest on Reserve Balances (IORB). This dynamic severely hampered trading institutions’ ability to secure adequate funding from banks, often compelling them into forced repayments.
While the Federal Reserve announced its second interest rate cut of the year at the October 29 FOMC meeting, leading many to anticipate a release of mid-term liquidity, this perspective often overlooked critical microstructural impediments. In reality, the net liquidity injected by the Federal Reserve into the market had been in continuous decline since late July.
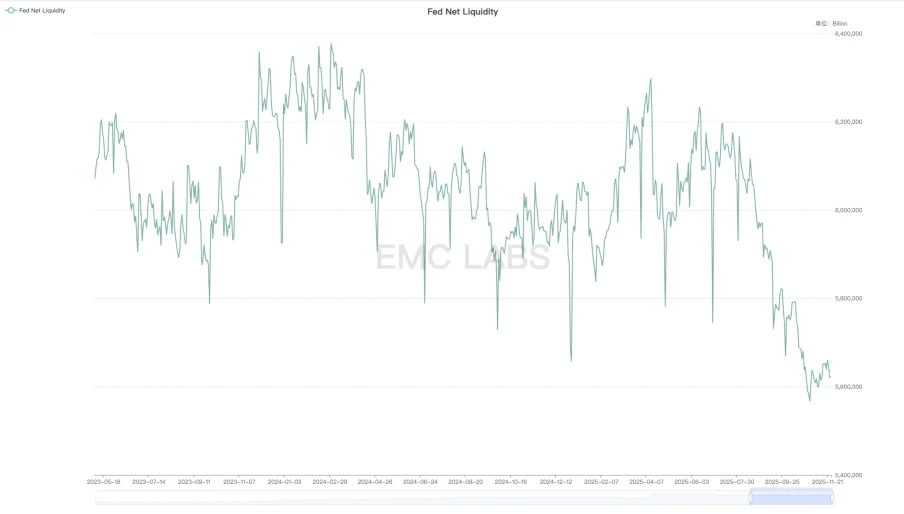
This tightening liquidity environment inevitably escalated funding costs across trading markets, exerting significant downward pressure on the valuations of high-beta assets, including prominent US AI concept stocks and Bitcoin (BTC).
EMC Labs observed a direct correlation: as actual liquidity progressively diminished, market risk appetite deteriorated, and this valuation pressure ultimately triggered a sequential sell-off of high-beta assets. BTC, given its inherent volatility, was notably the first link in this divestment chain.
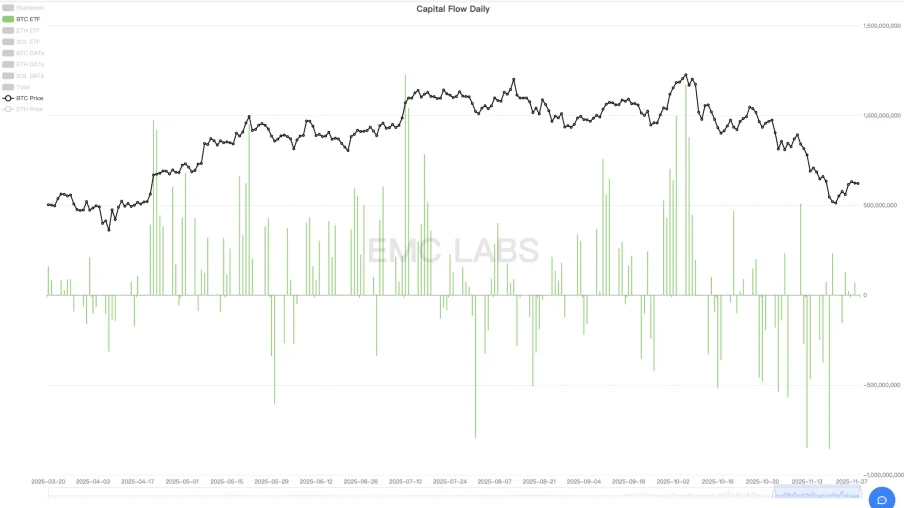
Despite robust BTC ETF inflows in early October that propelled Bitcoin to new all-time highs, this momentum quickly reversed. Following a plunge in Federal Reserve market liquidity injection, BTC ETF flows turned negative and have largely remained in significant outflow territory ever since.
Nasdaq AI concept stocks, also considered high-beta assets, demonstrated a degree of resilience compared to crypto assets, which often lack comparable fundamental backing. Even after BTC initiated its rebalancing and decline, these AI stocks continued to forge new all-time highs, propelled by stronger-than-expected earnings reports from the “Magnificent Seven.” Their significant downturn only commenced on November 4.
The breakdown in US equities further accelerated capital outflows from the cryptocurrency market. This was driven by a dual dynamic: persistent withdrawals from BTC ETF channels and intensified selling from the “long-hand” holder cohort within the crypto market itself. This confluence of factors caused BTC, which had already begun its descent prior to the Nasdaq, to experience a sharper downward spiral, ultimately reaching the low point of this correction on November 21, in tandem with the Nasdaq.
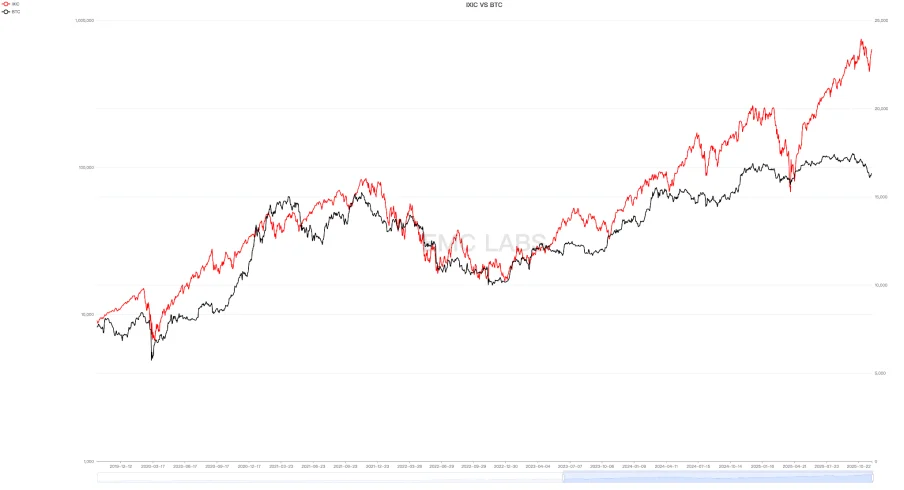
Notably, BTC’s correction preceded the Nasdaq’s by nearly a month, and its magnitude was almost four times greater (BTC: -36.45% vs. Nasdaq: -8.87%), demonstrating an elasticity 2-3 times higher than previous instances.
Beyond the immediate pressure from short-term liquidity, our attention remained fixed on a crucial indicator for mid-term liquidity expectations: the probability of a Federal Reserve rate cut in December. In October, this expectation soared to an impressive 98.78% on October 20. However, persistent “hawkish” rhetoric from Fed officials subsequently drove this probability down to a low of 30.07% by November 19. This erosion of mid-term liquidity expectations, and the resultant shift in capital risk appetite, undeniably intensified the sell-off of high-beta, long-duration assets by traders.
The US government shutdown concluded on November 12, initiating a gradual, albeit slow, release of short-term liquidity. Yet, the Federal Reserve’s continued “hawkish” stance meant that the probability of a December rate cut continued to decline post-shutdown. Our analysis suggests that this market downturn and subsequent price rebalancing in both US equities and the cryptocurrency market were primarily driven by an initial phase of genuine short-term liquidity exhaustion, followed by a pervasive pessimistic outlook on mid-term liquidity.
The true inflection point for both BTC and US equities arrived on November 21. On that Friday, John Williams, President of the New York Federal Reserve Bank and a key figure within the Fed, articulated in a public forum that downside risks to employment had increased, suggesting room for further adjustments to the federal funds rate to align policy closer to a neutral stance. This statement, widely interpreted as reflecting the Federal Reserve’s “management-level” sentiment, rapidly propelled the implied probability of a December rate cut above 70% that same day, leading to a significant rebound in both US stocks and BTC.
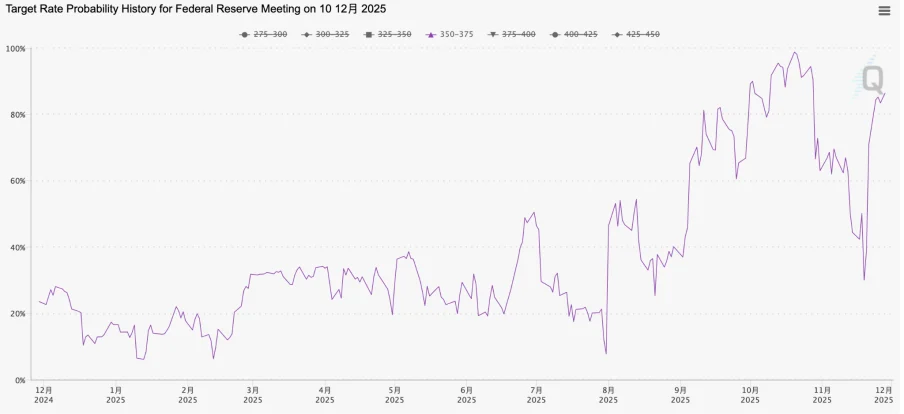
Further bolstering this sentiment, the Federal Reserve’s Beige Book, released on November 26, confirmed a deterioration in economic and employment conditions. This critical information alleviated market anxieties that the Fed might opt for a conservative stance and refrain from cutting rates in December due to insufficient economic and employment data. Consequently, the FedWatch probability for a December rate cut steadily climbed above 80%, effectively transforming what Powell had described on October 30 as “far from a done deal” into a virtual certainty within a month.
The November adjustment in US equities also reflected growing concerns over the elevated valuations of AI concept stocks, leading to a significant 20% correction in bellwether Nvidia, accompanied by a tepid rebound. However, the overarching driver was a dual adjustment in both risk appetite and valuations, precipitated by short-term liquidity pressures and the unpredictable nature of mid-term liquidity. Thus, with the emergence of a short-term liquidity inflection point and the December rate cut probability reverting to high levels, the Nasdaq registered gains across all four trading days in the final week of November, actively attempting to reclaim its all-time high set on October 29.
Despite the robust rebound in US equities, which suggests a dissipation of immediate market risks, the broader liquidity landscape remains precarious. Short-term liquidity has yet to show a significant recovery. Regarding mid-term liquidity, while a December rate cut appears almost certain, the continuation of market rate cuts into the first quarter of next year will be contingent upon forthcoming economic and employment data.
Internal Dynamics: Repricing and a Major Handover
While the liquidity crisis has reached an inflection point, potentially allowing the Nasdaq to swiftly reclaim its prior historical highs, Bitcoin’s (BTC) synchronous rebound has demonstrated significantly weaker elasticity. BTC still lags over 38% below its October 6 all-time high. We posit that this subdued price performance is attributable to two main factors: BTC’s inherent higher volatility compared to the Nasdaq, and critically, severe internal structural damage compounded by “cycle law” driven selling.
Firstly, an analysis of comprehensive cryptocurrency market fund flows via the eMerge Engine reveals that the crypto market experienced a net outflow exceeding $3.6 billion in November. Breaking this down, BTC ETF channels accounted for $3.382 billion in outflows, ETH ETF channels saw $1.352 billion in outflows, and stablecoins registered $615 million in outflows. Interestingly, SOL ETF recorded a positive inflow of $412 million, and BTC/ETH/SOL treasury companies collectively reported net inflows totaling approximately $1.298 billion.
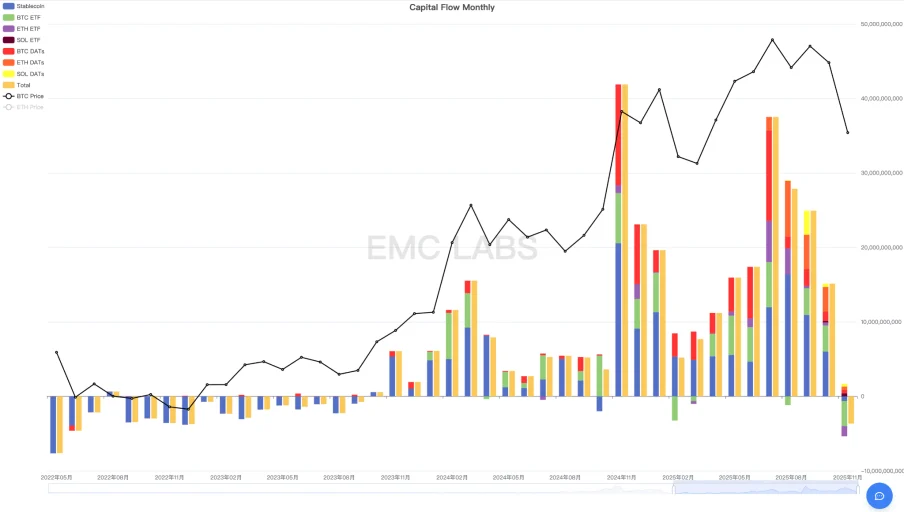
November marked the largest single-month outflow for the cryptocurrency market in the current cycle, a significant shift following three consecutive months of diminishing inflows. This substantial outflow is the fundamental reason behind BTC’s largest monthly decline this cycle. Critically, outflows from BTC ETF channels constituted 93.94% of the total market outflow, leading us to primarily attribute this correction to the liquidity crisis instigating a downward repricing of high-beta assets like BTC.
Secondly, a significant contributing factor is the cyclical deleveraging by “long-hand” holders, driven by the inherent “cycle law” of Bitcoin. Since the inception of this cycle, the BTC long-hand cohort has engaged in three major waves of selling. The first occurred from January to March 2024, the second from October 2024 to January 2025, and the third, coinciding with this deep price correction in BTC, spanned from July to November 2027.
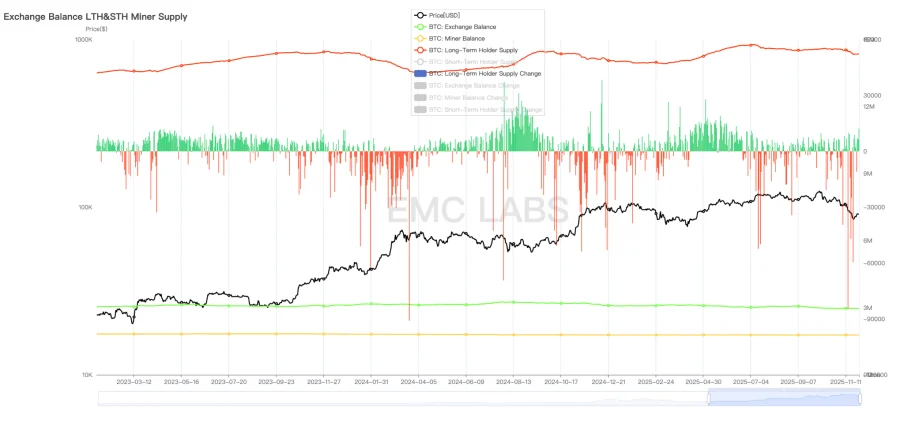
Unlike previous waves of significant deleveraging that occurred during periods of BTC price appreciation, this latest wave of selling predominantly unfolded between July and November, amidst a stagnant or even rapidly declining price environment. This behavior from the long-hand cohort is not anomalous; it aligns with their historical actions following a “bull-to-bear” transition. Considering the profound influence of the “mental imprint” left by the halving-driven bull markets over more than a decade, coupled with the “coincidental” timing of BTC reaching past cycle bull market highs around October, we contend that a substantial segment of long-hand holders is indeed adhering to the “cycle law,” initiating selling after perceiving a “bull-to-bear” shift. This sustained selling has been a crucial factor amplifying BTC’s recent decline.
Finally, BTC’s recent downturn was not solely constrained by the aforementioned two factors. Additional negative influences included futures arbitrage traders and cryptocurrency market makers being severely impacted by events such as the “Binance USDe de-pegging incident.”
Amidst this brutal decline, while some engaged in significant selling, others strategically accumulated. This dynamic ultimately led to a large-scale handover of BTC. Following the inflection point in macroeconomic liquidity expectations, the market has finally found a moment of respite.
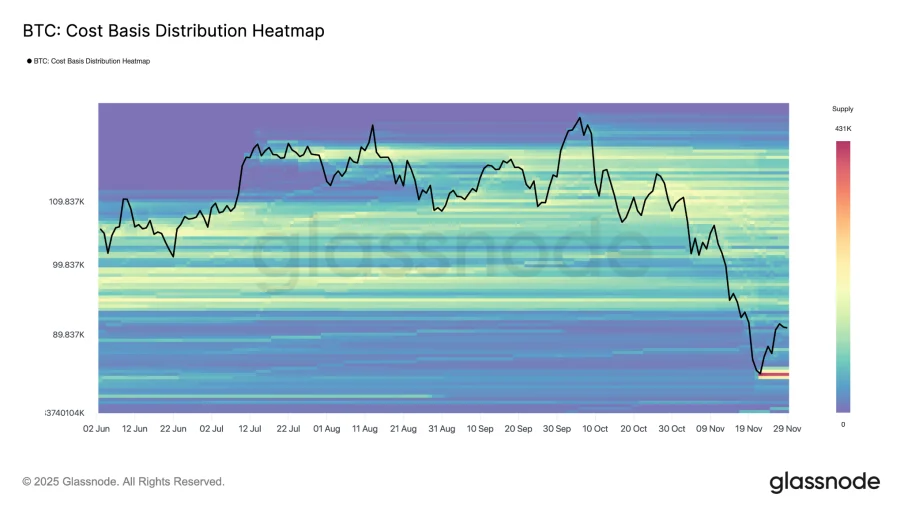
Through detailed on-chain BTC data analysis, we’ve identified a pivotal price point around $84,000, where over 430,000 BTC were repriced. This marks a significant chapter in Bitcoin’s redistribution history.
Historically, long-hand BTC holders have consistently accumulated tokens during market downturns, gradually selling them to new, shorter-term entrants during rallies. This fundamental dynamic, alongside Bitcoin’s halving events, has traditionally defined the bull-bear transitions of past BTC cycles. Today, however, with the growing institutional acceptance of BTC on Wall Street, the ownership structure is undergoing a profound transformation. BTC ETF holders and treasury companies are emerging as a new class of long-term investors. We have frequently explored in our previous monthly reports whether this evolving market structure will fundamentally alter the “old cycle” dynamics and if a “new cycle” will successfully forge a distinct pattern.
As of now, the answer remains elusive. However, if this latest wave of selling by long-hand BTC holders ultimately dampens market enthusiasm and reverses the prevailing trend, pushing the market back into a bear phase, then it would suggest that the “new cycle” has yet to successfully take shape.
Conclusion: Navigating the Crossroads of Cycles
November’s market turbulence was fundamentally driven by a dual macroeconomic squeeze: the exhaustion of short-term liquidity and a pessimistic shift in mid-term liquidity expectations. This environment triggered a significant valuation correction and downward repricing across a spectrum of assets, including Nasdaq AI concept stocks and the broader cryptocurrency market. Subsequently, as these expectations began to pivot, both markets initiated a rebound.
However, the intensity of this adjustment within the cryptocurrency market was significantly amplified by its inherent internal dynamics and structural vulnerabilities.
This latest correction witnessed the largest single-month capital outflow and the most substantial BTC drawdown of the current cycle.
Based on this analysis, we pinpoint November 21 as the short-term price inflection point. Looking ahead, an anticipated December rate cut and the eventual cessation of the Federal Reserve’s Quantitative Tightening (QT) are expected to improve US macroeconomic liquidity. This could potentially catalyze a fresh wave of capital inflows into the cryptocurrency market, further fueling a price rebound. Should BTC manage to align with a continued US stock bull market into 2026 and achieve new all-time highs, it would signify a definitive departure from the “old cycle,” ushering in a new era dominated by Wall Street institutions. Conversely, if capital inflows fail to materialize, it would indicate the failure of the “new cycle” to take shape, reaffirming the dominance of the “old cycle,” and signaling a potential return to a bear market for BTC, seeking new lows after the bull run initiated in November 2022.
(The above content is an authorized excerpt and reproduction from our partner PANews. Original Link | Source: EMC Labs)
Disclaimer: This article is provided for market information purposes only. All content and opinions are for reference only and do not constitute investment advice. They do not represent the views or positions of BlockBeats. Investors should make their own decisions and conduct their own transactions. The author and BlockBeats will not assume any responsibility for direct or indirect losses incurred by investors’ transactions.