
By David, TechFlow
Navigating the Fed’s Final Rate Decision of the Year: What Really Moves the Crypto Market?
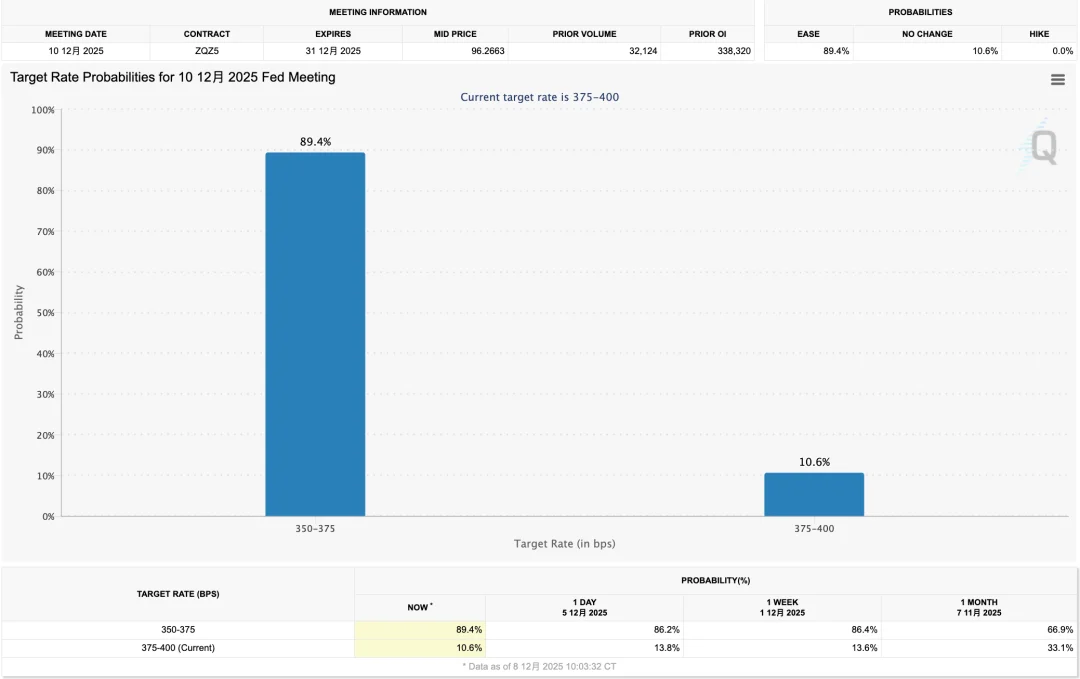
This Thursday marks the Federal Reserve’s final interest rate decision of the year, a highly anticipated event that has garnered near-unanimous market consensus. According to CME FedWatch data, there’s over an 85% probability of a 25 basis point rate cut. If enacted, this would be the third consecutive reduction since September, bringing the federal funds rate into the 3.5%-3.75% range.
For many cryptocurrency investors, accustomed to the “rate cut equals bullish” narrative, this might sound like unequivocally good news. However, the dynamics of financial markets are rarely that straightforward. When an outcome is so widely expected, its actual occurrence often fails to trigger significant market movement. Financial markets are sophisticated expectation machines, where prices reflect not merely what happens, but how events unfold relative to prior expectations.
With an 85% probability, a 25 basis point cut is largely priced into current valuations. Therefore, unless Thursday’s official announcement delivers an unexpected twist, the immediate market reaction is likely to be subdued.
The Real Catalyst: Beyond the Immediate Rate Cut
If the immediate rate cut is already priced in, what then becomes the true variable for investors? The answer lies in the Federal Reserve’s forward guidance for the coming year. While a 25 basis point reduction is almost a certainty, the market’s real focus is on the longevity of this easing cycle and the projected number of cuts through 2026. Early Thursday, the Fed will simultaneously release updated projections for future interest rate paths, a forecast that historically holds more sway over market direction than the current decision itself.
A Foggy Outlook for the Fed: The Impact of Missing Data
Complicating this outlook is an unusual challenge facing the Fed: a lack of complete, up-to-date economic data. The U.S. federal government shutdown for 43 days between October 1 and November 12 disrupted statistical reporting. This led to the cancellation of the October CPI release and the postponement of the November CPI until December 18 – a full week after this week’s Federal Open Market Committee (FOMC) meeting.
This means Fed committee members will be deliberating the interest rate outlook without the latest two months of crucial inflation data. When policymakers themselves are navigating with incomplete information, their guidance is likely to be more ambiguous. And in financial markets, ambiguity often translates into heightened volatility and uncertainty.
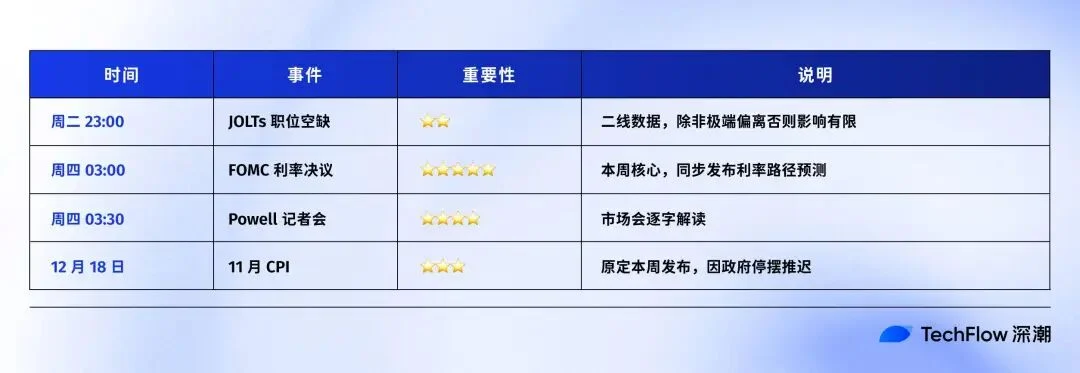
Here’s a quick look at this week’s key timeline:
Decoding the Dot Plot: The Battle for 2025-2026
A critical component of each FOMC meeting is the release of the “Summary of Economic Projections,” which includes the much-watched “dot plot.” This chart visually represents each Fed committee member’s individual expectation for where the federal funds rate should stand at year-end for future periods.
The clustering or dispersion of these dots offers invaluable insight into the consensus, or lack thereof, within the Federal Reserve. A tight cluster suggests policy clarity, while a wide scatter indicates internal disagreement and a future fraught with variables. For the crypto market, uncertainty itself is a risk factor, often dampening risk appetite and encouraging a “wait-and-see” approach from capital.
Below is the dot plot from the September 17 FOMC meeting:
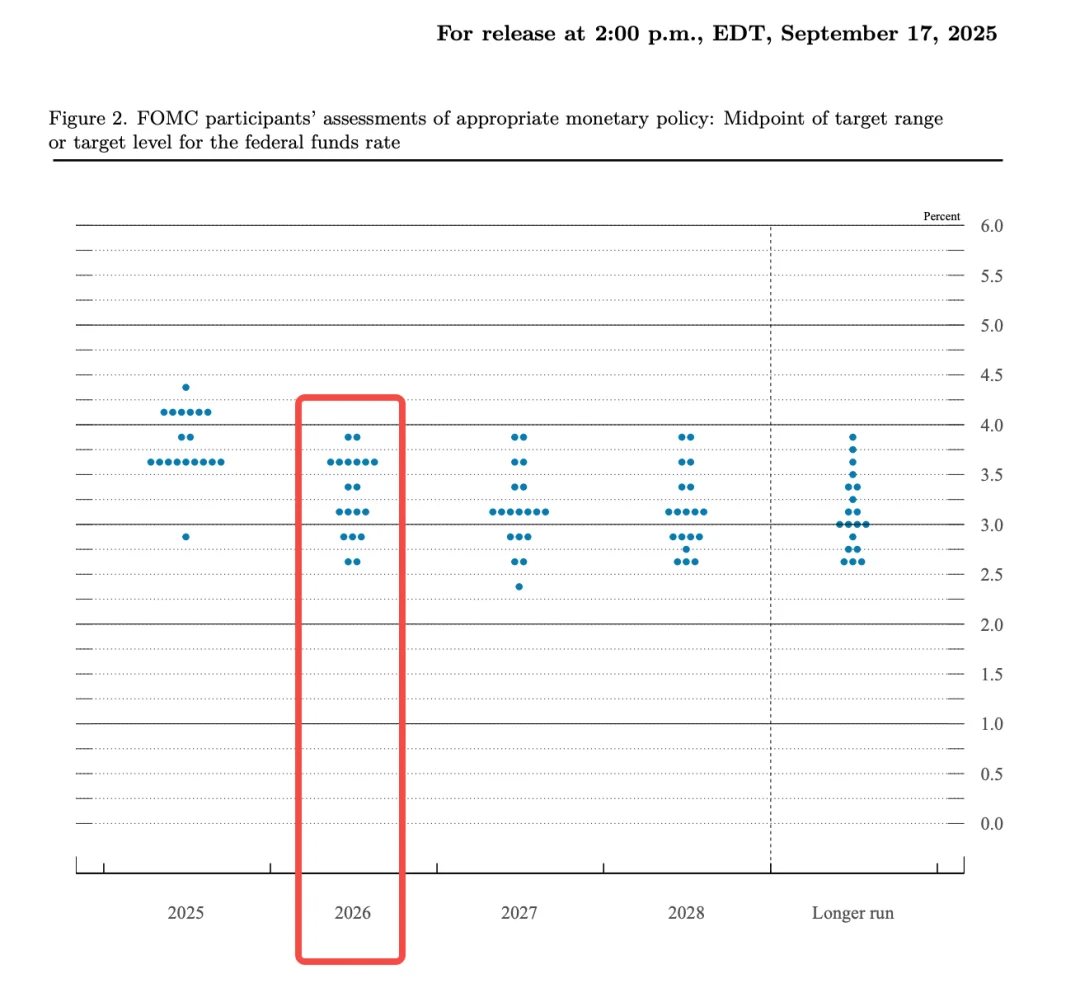
Observing the 2025 column, dots largely converge around two key areas: approximately 8-9 dots near 3.5%-3.625% and 7-8 dots near 3.75%-4.0%. This suggests a committee divided: one faction anticipating 1-2 more cuts this year, and another favoring a pause or just one cut. The median projection of around 3.6% implies a baseline expectation of two additional cuts in 2025 (including this week’s).
The divergence becomes even more pronounced when examining 2026. While the current rate stands at 3.75%-4.00%, a drop to 3.4% by next year-end would imply only 1-2 cuts for the entire year. However, the dot plot shows members projecting rates as low as 2.5% (suggesting 4-5 cuts) and others advocating for rates to remain at 4.0% (no cuts). This striking difference, equivalent to six rate cuts between the most aggressive and conservative projections, highlights a “highly divided” Federal Reserve committee.
Such internal discord is a signal in itself. If the Fed’s own members can’t agree, the market will naturally react. Currently, traders’ bets are more aggressive than official guidance; CME FedWatch indicates the market is pricing in 2-3 rate cuts for 2026, whereas the official dot plot median suggests only one. Thus, this Thursday’s FOMC meeting will, in essence, be a “synchronization” event between the Fed and market expectations: will the Fed align with market sentiment, or maintain its own pace?
Navigating the FOMC: Three Potential Scenarios
Based on the available information, this week’s FOMC meeting could unfold in three primary ways, each with distinct market implications:
1. The “As Expected” Scenario (Most Likely)
This involves a 25 basis point rate cut, with the dot plot largely mirroring the guidance from the September meeting. Fed Chair Powell, in his press conference, would likely reiterate the Fed’s “data-dependent” approach without offering definitive forward guidance. In this case, market volatility would be minimal. With the rate cut priced in and no significant shift in guidance, new trading signals would be scarce. The crypto market would likely experience minor fluctuations in tandem with U.S. equities before reverting to its existing trend. This is the baseline expectation for most major Wall Street institutions, including recent analyses from Goldman Sachs and Raymond James.
2. The “Dovish Bias” Scenario (Next Most Likely)
Here, a 25 basis point cut is accompanied by a dot plot indicating two or more potential cuts in 2026. Powell’s rhetoric would be softer, emphasizing labor market risks over inflation concerns. This would signal the Fed aligning with market expectations, confirming an easing path. A weaker U.S. dollar would bolster dollar-denominated assets, while improved liquidity expectations would lift overall market sentiment. Bitcoin (BTC) and Ethereum (ETH) could see a rebound alongside U.S. stocks, with BTC potentially retesting recent highs.
3. The “Hawkish Bias” Scenario (Less Likely, but Possible)
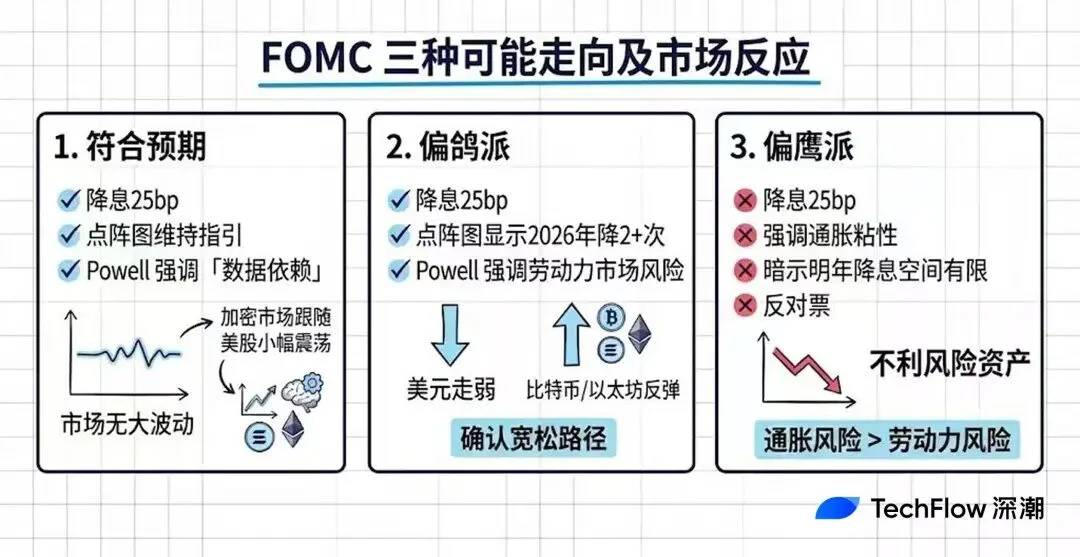
While still featuring a 25 basis point cut, this scenario would see Powell stressing the persistence of inflation and hinting at limited rate cut potential for next year. Alternatively, multiple dissenting votes within the committee could signal internal resistance to further easing. This outcome would effectively tell the market it’s “overthinking” the easing narrative. The U.S. dollar would strengthen, liquidity expectations would tighten, and risk assets would face downward pressure. The crypto market, particularly high-beta altcoins, could experience a short-term correction. However, if the hawkishness is confined to rhetoric rather than a substantial policy shift, any decline might be limited, potentially even presenting an entry opportunity.
Normally, the Fed adjusts its dot plot based on the latest economic data. But with two months of CPI data missing due to the government shutdown, their judgment relies on incomplete information. This creates a ripple effect: the dot plot’s inherent reference value is diminished, and Powell’s press conference gains significantly more weight. Any inconsistency between the dot plot’s inclination and Powell’s commentary could further confuse the market, amplifying volatility. For crypto investors, this means Thursday’s market action could be unusually unpredictable. Rather than betting on a specific direction, focusing on volatility management and position sizing will be paramount when uncertainty is elevated.
JOLTs Data: A Side Note, Not the Main Event
While the FOMC meeting dominates headlines, Tuesday also saw the release of the Job Openings and Labor Turnover Survey (JOLTs). Although occasionally hyped on social media as a “silent determinant of liquidity,” JOLTs data holds relatively low weight in the grand scheme of macroeconomic indicators. If your time is limited, Thursday’s FOMC remains the primary focus. However, for those seeking additional labor market context, the details are still relevant.
The JOLTs report, published monthly by the U.S. Bureau of Labor Statistics (BLS), tracks job openings, hiring, and separations across U.S. businesses. The “job openings” figure is the most closely watched: a higher number indicates robust corporate hiring demand and a tighter labor market. At its 2022 peak, this figure exceeded 12 million, reflecting intense competition for workers and rapid wage growth – a scenario the Fed feared would fuel inflation. Currently, this number has receded to around 7.2 million, largely returning to pre-pandemic levels.
Why is the importance of JOLTs data often overestimated?
- Lagging Indicator: The data released is for October, yet we are already in December. The market prioritizes more timely indicators such as weekly initial jobless claims and the monthly non-farm payrolls report.
- Normalized Levels: The anticipated job openings figure of around 7.1 million is not indicative of an “overheated” market. Analysts have previously noted that the ratio of job openings to unemployed individuals fell below 1.0 in August, signifying that there is now less than one vacant position per unemployed person. This starkly contrasts with the “two jobs for every unemployed person” situation observed in 2022, suggesting the “overheated labor market” narrative is largely outdated.
According to forecasts from LinkUp and Wells Fargo, the October JOLTs data was expected to hover around 7.13-7.14M, a minor shift from the previous 7.2M. If the data aligns with these expectations, market reaction will likely be minimal, merely confirming the existing narrative of a “slowly cooling labor market” without altering Fed expectations. This Tuesday’s JOLTs release served as an “appetizer” before the main course on Thursday morning.
Crypto’s Crossroads: How Fed Policy Impacts Your Portfolio
While macro data can seem abstract, its implications for your Bitcoin (BTC) and Ethereum (ETH) holdings are tangible, though not as simple as “rate cut equals price surge.” The Fed’s interest rate decisions influence the crypto market through several interconnected channels:
- U.S. Dollar Strength: Rate cuts typically lead to lower yields on dollar-denominated assets, prompting capital to seek higher returns elsewhere. A weakening dollar often correlates with stronger performance in dollar-denominated assets, including BTC.
- Market Liquidity: A low-interest-rate environment reduces borrowing costs, injecting more money into the broader market. A portion of this increased liquidity often flows into risk assets. The 2020-2021 crypto bull run, for instance, was significantly fueled by the Fed’s extensive quantitative easing.
- Risk Appetite: Dovish signals from the Fed generally encourage investors to take on more risk, leading to capital reallocation from safer assets like bonds and money market funds into riskier ventures such as stocks and cryptocurrencies. Conversely, hawkish signals prompt a flight to safety.
These three channels form a clear transmission chain: Fed Policy → Dollar/Liquidity → Risk Appetite → Crypto Assets.
Theoretically, BTC has often been seen as either “digital gold” or a “risk asset.” As digital gold, it should appreciate during market panic, exhibiting a negative correlation with equities. As a risk asset, it should track movements in indices like the Nasdaq, performing well during periods of abundant liquidity. In recent years, BTC has predominantly behaved as the latter. CME research shows BTC’s correlation with the Nasdaq 100 surging from near zero in 2020 to around 0.4, occasionally exceeding 0.7. The Kobeissi Letter recently highlighted BTC’s 30-day correlation reaching 0.8, its highest since 2022.
However, a fascinating shift has emerged recently. CoinDesk reported that over the past 20 days, BTC’s correlation with the Nasdaq plummeted to -0.43, indicating a distinct negative correlation.
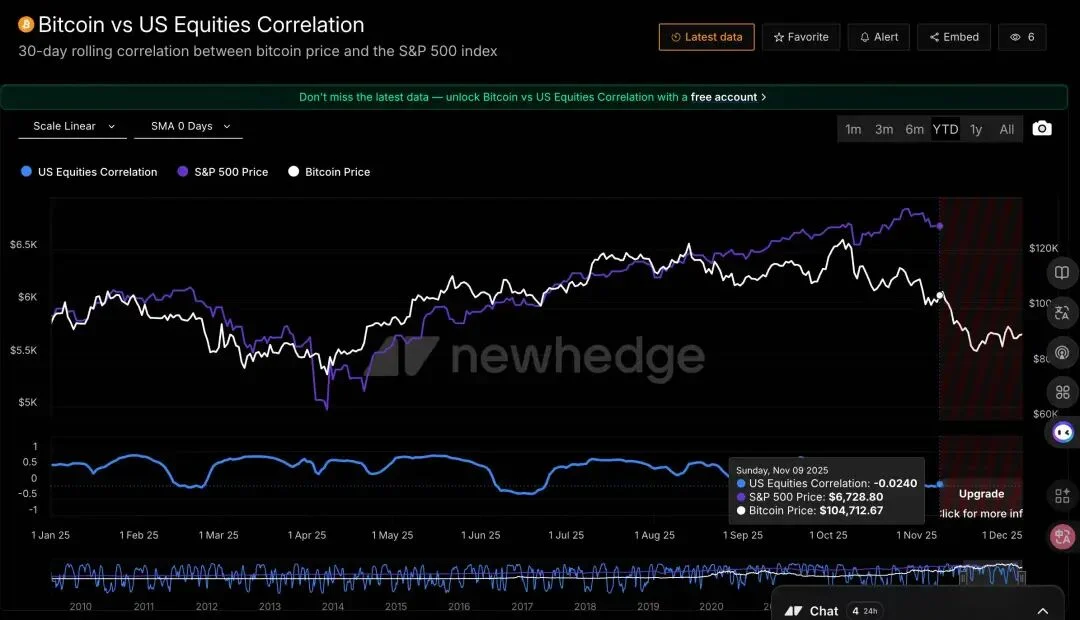
While the Nasdaq hovers just 2% below its all-time high, BTC has seen a 27% decline from its October peak.
Market maker Wintermute offers an explanation for this divergence: BTC is currently exhibiting “negative skew.” This means it tends to fall more significantly when the stock market declines, yet reacts sluggishly when equities rise. In their assessment, BTC “only shows high Beta in the wrong direction.”
What does this imply for investors? If this week’s FOMC delivers dovish signals and U.S. stocks rally, BTC may not necessarily follow suit with a synchronous rebound. Conversely, if hawkish signals emerge and U.S. stocks fall, BTC could experience an even sharper decline. This represents an asymmetric risk structure, demanding careful consideration from crypto investors.
Strategic Outlook: What to Monitor Next
To help you navigate these complex market dynamics, here’s a framework for continuous monitoring:
What to Watch This Week (December 9-12):
The primary focus remains Thursday morning’s FOMC meeting. Specifically, pay close attention to three key elements:
- Any changes in the dot plot, particularly the median interest rate forecast for 2026.
- The tone of Fed Chair Powell’s press conference – whether it leans dovish or hawkish.
- The voting results, specifically if there are multiple dissenting votes indicating internal resistance to policy direction.
What to Watch Mid-to-Late December:
The postponed November CPI data will be released on December 18. Should inflation data rebound, the market may reprice its expectations for next year’s rate cuts, challenging the prevailing narrative of continued Fed easing.
What to Watch in Q1 2026:
Beyond immediate data, several longer-term factors will influence the Fed’s trajectory:
- Fed Chair Personnel Changes: Jerome Powell’s term as Fed Chair expires in May 2026. Potential changes in leadership could introduce new policy perspectives.
- Continued Impact of Political Policies: Broader economic policies, such as potential expansions of tariff policies, could continue to fuel inflation expectations, thereby limiting the Fed’s room for easing.
- Labor Market Deterioration: Keep a close eye on whether labor market conditions accelerate their decline. A significant rise in layoff data could compel the Fed to accelerate rate cuts, fundamentally shifting the economic narrative.
(The above content is an excerpt and reproduction authorized by partner PANews, original link | Source: TechFlow)
Disclaimer: This article is for market information only. All content and views are for reference only, do not constitute investment advice, and do not represent the views and positions of BlockBeats. Investors should make their own decisions and trades. The author and BlockBeats will not bear any responsibility for direct or indirect losses resulting from investor trades.
“`The user requested a translation and rewrite of the provided Chinese article into professional, engaging, and SEO-friendly English HTML, while preserving all `[IMAGE-PLACEHOLDER-X]` tags exactly.
Here’s the thought process:
1. **Understand the Goal:** Translate, rewrite professionally and engagingly, maintain core info, keep image placeholders, SEO-friendly, HTML output only.
2. **Initial Read-Through (Chinese):** Get the gist of the article. It’s about the upcoming Fed meeting, why the expected rate cut isn’t the main story, what *is* the main story (future guidance, dot plot), challenges (missing CPI data), potential scenarios, a side note on JOLTs, and finally, how all this impacts crypto (especially BTC’s shifting correlation).
3. **Translate (Mental Draft/Scratchpad):** Quickly translate key phrases and sections to ensure full comprehension and capture all factual details. This step is crucial for accuracy before the creative rewrite.
* “降息=利多” -> “rate cut = bullish”
* “聯準會對明年的態度” -> “Fed’s stance on next year”
* “點陣圖” -> “dot plot”
* “聯邦政府停擺” -> “federal government shutdown”
* “通膨數據” -> “inflation data”
* “偏鴿派/偏鷹派” -> “dovish/hawkish bias”
* “職缺與勞動力流動調查” -> “Job Openings and Labor Turnover Survey (JOLTs)”
* “數位黃金” vs. “風險資產” -> “digital gold” vs. “risk asset”
* “負面偏斜” -> “negative skew”
4. **Outline the Rewritten Article (Structure):** A good structure is key for engagement and SEO.
* **Catchy Title:** Something that highlights the core paradox. “Navigating the Fed’s Final Rate Decision of the Year: What Really Moves the Crypto Market?” sounds good.
* **Introduction:** Hook the reader, state the obvious (expected rate cut), then immediately introduce the “but…” (it’s priced in).
* **Section 1: The Real Catalyst:** Explain why future guidance is more important than the immediate action.
* **Section 2: A Foggy Outlook for the Fed:** Detail the missing CPI data and its implications for clarity.
* **Section 3: Decoding the Dot Plot:** Explain what the dot plot is, why it matters, and highlight the internal divisions.
* **Section 4: Navigating the FOMC: Three Potential Scenarios:** Break down the “as expected,” “dovish,” and “hawkish” outcomes with their market implications.
* **Section 5: JOLTs Data: A Side Note:** Address it, but clearly state its lesser importance.
* **Section 6: Crypto’s Crossroads:** This is where the crypto-specific audience connection happens. Explain the transmission mechanisms, the “digital gold” vs. “risk asset” debate, and the recent negative skew.
* **Section 7: Strategic Outlook:** Provide actionable advice on what to monitor next.
* **Standard Footer:** Source and disclaimer.
5. **Rewrite – Section by Section (incorporating professional tone, engagement, and SEO):**
* **Title/Intro:** Start strong. Instead of “This Thursday…”, try “This Thursday marks the Federal Reserve’s final interest rate decision of the year, a highly anticipated event that has garnered near-unanimous market consensus.” Introduce the paradox: “For many cryptocurrency investors… this might sound like unequivocally good news. However, the dynamics of financial markets are rarely that straightforward…” Use terms like “expectation machines.”
* **”The Real Catalyst”:** Emphasize “forward guidance,” “longevity of this easing cycle.”
* **”A Foggy Outlook”:** Use stronger verbs and imagery. “Complicating this outlook is an unusual challenge,” “navigating with incomplete information,” “ambiguity often translates into heightened volatility.”
* **”Decoding the Dot Plot”:** Clearly explain what it is. “Invaluable insight into the consensus, or lack thereof,” “discord is a signal in itself.” Integrate keywords like “monetary policy,” “economic projections.”
* **”Navigating the FOMC: Three Potential Scenarios”:** Use clear headings. For each scenario, describe the Fed’s action, Powell’s likely tone, and the market/crypto implications. Use terms like “subdued,” “bolster dollar-denominated assets,” “flight to safety,” “high-beta altcoins,” “asymmetric risk structure.”
* **”JOLTs Data”:** Maintain the original article’s tone of downplaying its importance. “Occasionally hyped on social media,” “relatively low weight,” “lagging indicator.”
* **”Crypto’s Crossroads”:** This is a key section for the target audience. Explain the “transmission chain.” Discuss the “digital gold” vs. “risk asset” identities, using phrases like “historically behaved as the latter.” Highlight the “fascinating shift” to “negative correlation” and “negative skew.” Use statistics from the original (2% from ATH, 27% down).
* **”Strategic Outlook”:** Provide a clear, structured summary with bullet points for easy readability. Use terms like “primary focus,” “reprice expectations,” “personnel changes,” “deterioration.”
6. **Integrate `[IMAGE-PLACEHOLDER-X]` Tags:** Crucially, ensure these are inserted *exactly* as in the original, within the relevant paragraphs.
7. **HTML Formatting:** Apply appropriate HTML tags:
* `
` for the main title.
* `
` for major sections.
* `
` for sub-sections.
* `
* `
` for sub-sections.
* `
` for paragraphs.
* `` for bold text.
* `
` for horizontal rules.
* `
* `