
Author: Frank, PANews
Unpacking the Crypto Market’s Deceptive Calm: A Deep Dive into Liquidity and Institutional Sentiment
Following the sharp market downturn on October 11, the cryptocurrency landscape appears to have settled into an extended period of tranquility. Yet, for astute investors, the critical question isn’t merely predicting the next price movement, but rather discerning the true state of market liquidity and understanding the prevailing sentiment among dominant capital players.
PANews has undertaken a comprehensive analysis, scrutinizing key indicators such as order book depth, options market dynamics, and stablecoin flows, to unravel the current capital patterns within the crypto ecosystem. Our findings suggest a stark reality: far from a genuine recovery, the market is entangled in a structural divergence, marked by persistently eroding liquidity and an accelerating defensive stance adopted by institutional funds.
Micro-Liquidity: A Precarious Balance and Vanishing Support
To truly grasp the current liquidity paradigm, the order book depth differential serves as an invaluable metric.
Examining the Binance BTC/USDT perpetual trading pair, a clear trend emerges since October: the depth of the buy-side order book has significantly diminished, contracting from a consistent $200 million-plus range to a more modest $100-200 million. Similarly, sell-side depth has also seen a noticeable reduction, now consistently below $200 million.
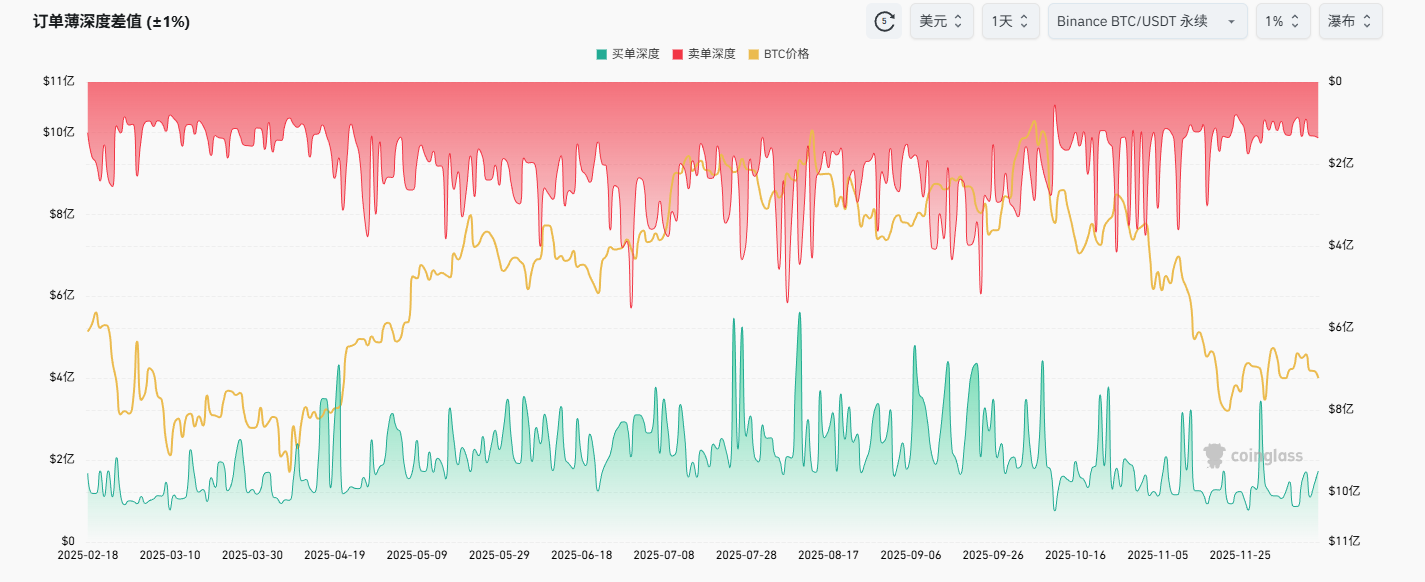
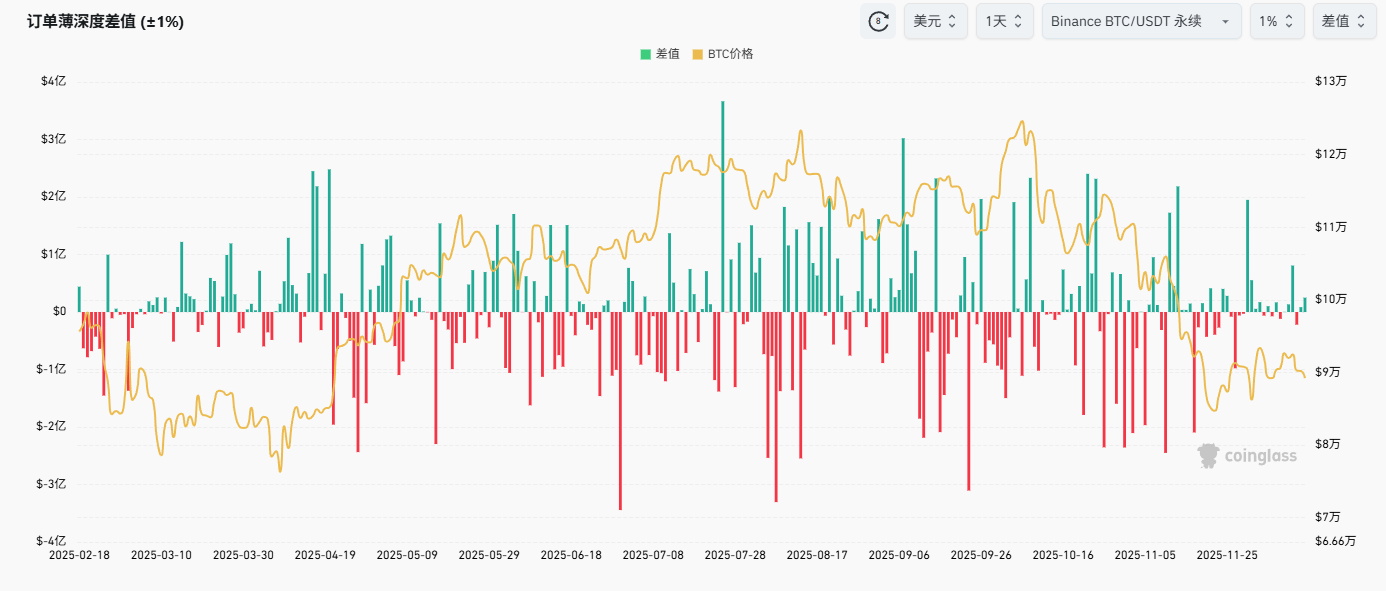
Furthermore, the spread between long and short order depths has recently achieved a precarious equilibrium, with daily differentials in November often hovering around just $10 million. These metrics collectively paint a picture of a market where bullish and bearish forces are relatively balanced, yet undergirded by a continuous and worrying decline in overall liquidity.
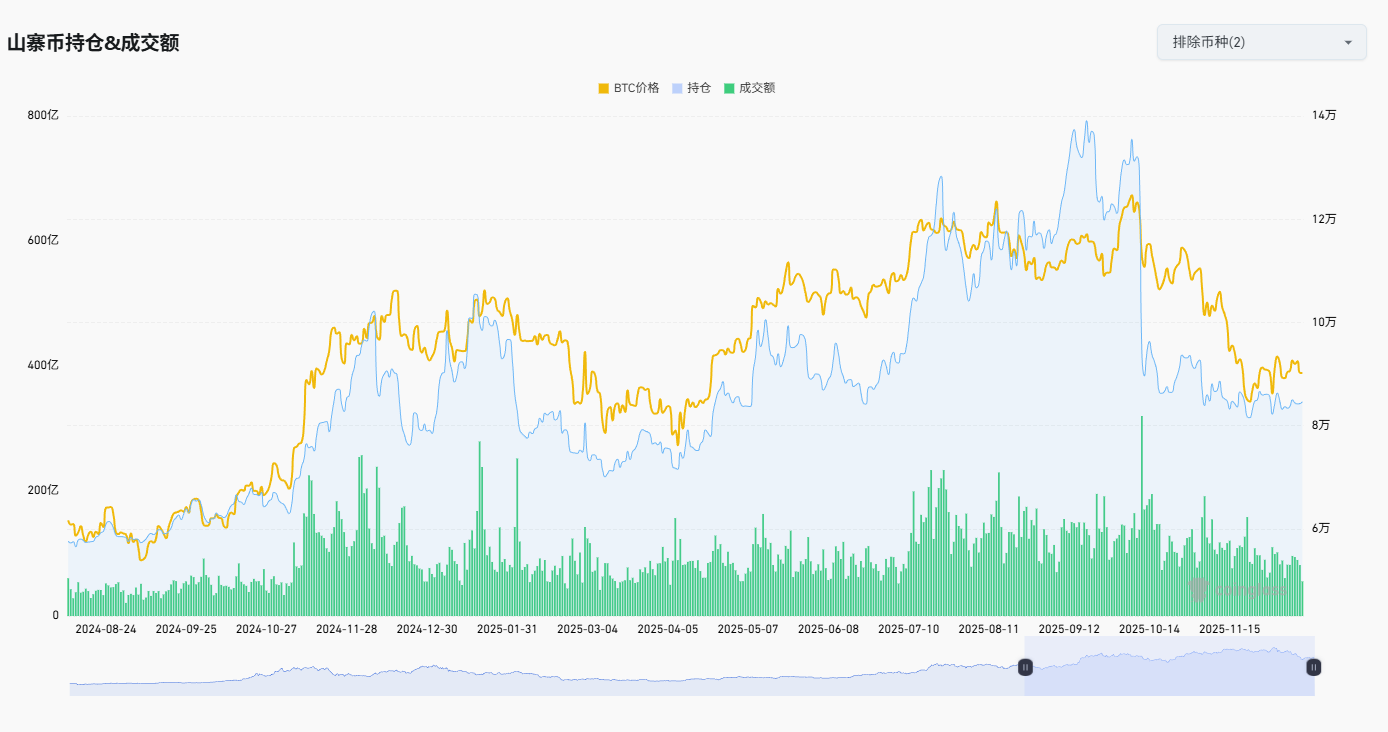
In terms of open interest, altcoins (excluding Bitcoin and Ethereum) have failed to demonstrate growth even as prices touched lower levels; instead, their open interest has also receded. This contrasts sharply with a significant market correction in April, where a substantial rebound in open interest was observed as prices bottomed out (a recovery that even preceded the absolute price lows).
Concurrently, trading volumes in the altcoin futures market are contracting, conspicuously lacking the surge typically associated with bottom-fishing activity. These indicators strongly suggest that the altcoin market has entered a phase of pronounced disinterest and neglect.
Options Market: Retail Chasing Lotteries, Institutions Fortifying Bearish Positions
A particularly intriguing data point lies in the crypto options-to-futures open interest ratio. For Bitcoin, this ratio has dramatically surged since the start of the year, at one point exceeding 100% and currently maintaining around 90%. Historically, BTC’s options share typically hovered around 60%. This shift underscores a profound transition in the Bitcoin market’s leadership, moving from futures contract dominance to a clear ascendancy of options contracts. Intriguingly, ETH’s equivalent ratio has plummeted to an exceptionally low 30% this year.
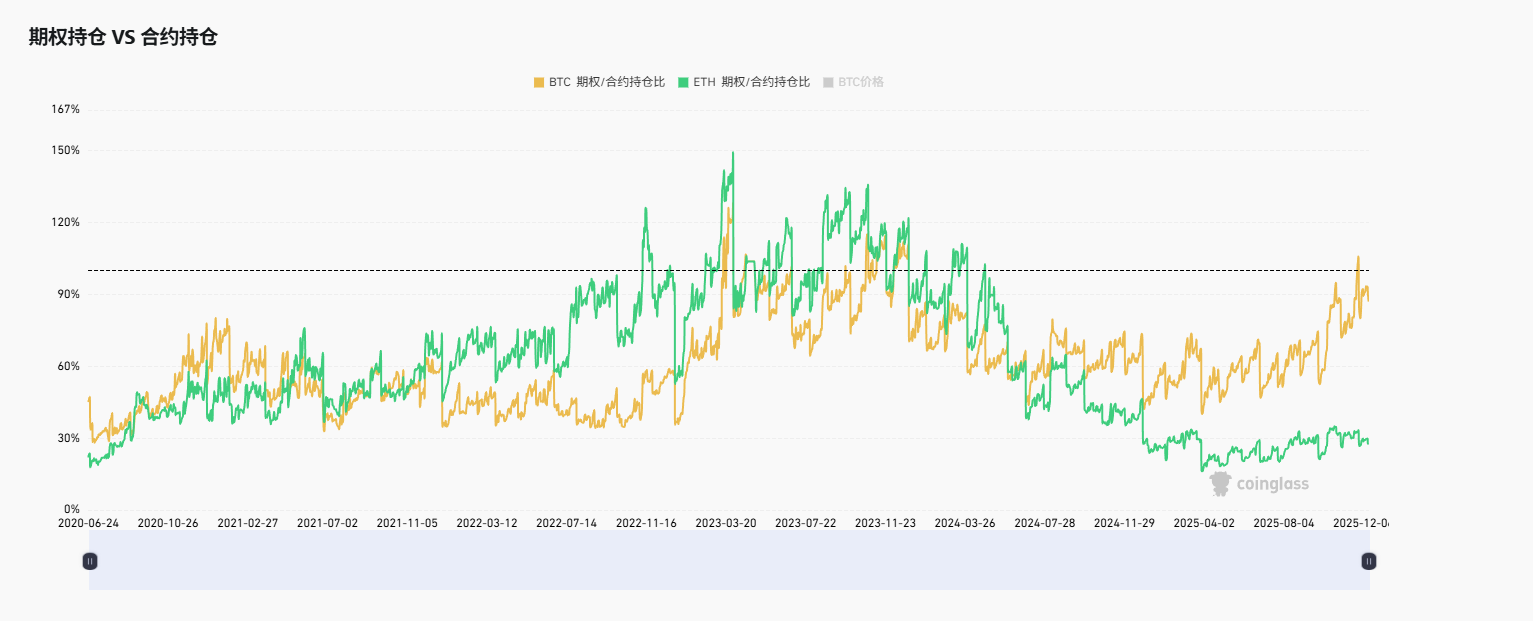
This divergence highlights two critical insights: Firstly, institutional and hedge fund influence over the Bitcoin market has solidified, while Ethereum and other altcoins appear to have fallen out of favor as primary trading vehicles for these sophisticated players. Secondly, options market data has become an increasingly vital barometer for forecasting Bitcoin’s trajectory. This trend is further corroborated by the persistently high total open interest in BTC options, even amidst price declines.
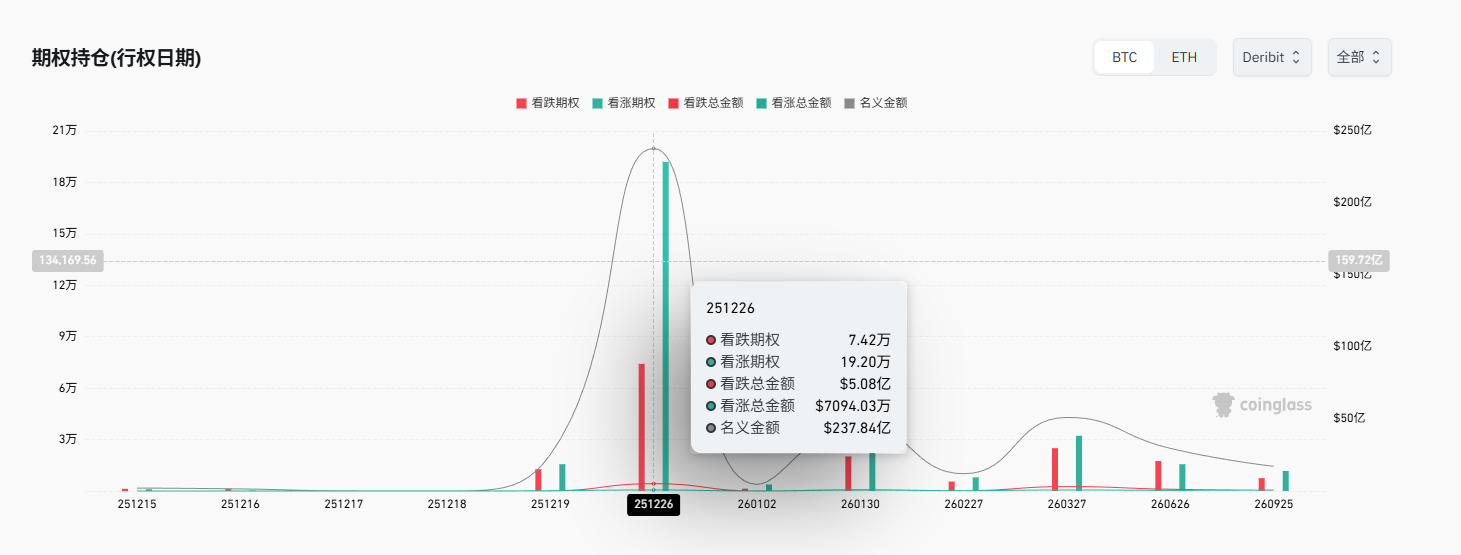
Consequently, Bitcoin options expiry dates and the “maximum pain” point have become pivotal reference indicators. Current data points to December 26 as the next significant options exercise date. While call options volume stands at a substantial 192,000 contracts against 74,200 put options, the underlying monetary value tells a different story: put options command a staggering $508 million, whereas call options are valued at a mere $71.25 million. This inverted valuation signifies that call options are remarkably inexpensive (around $370 per contract), while put options are exceedingly costly (reaching $6,800 per contract).
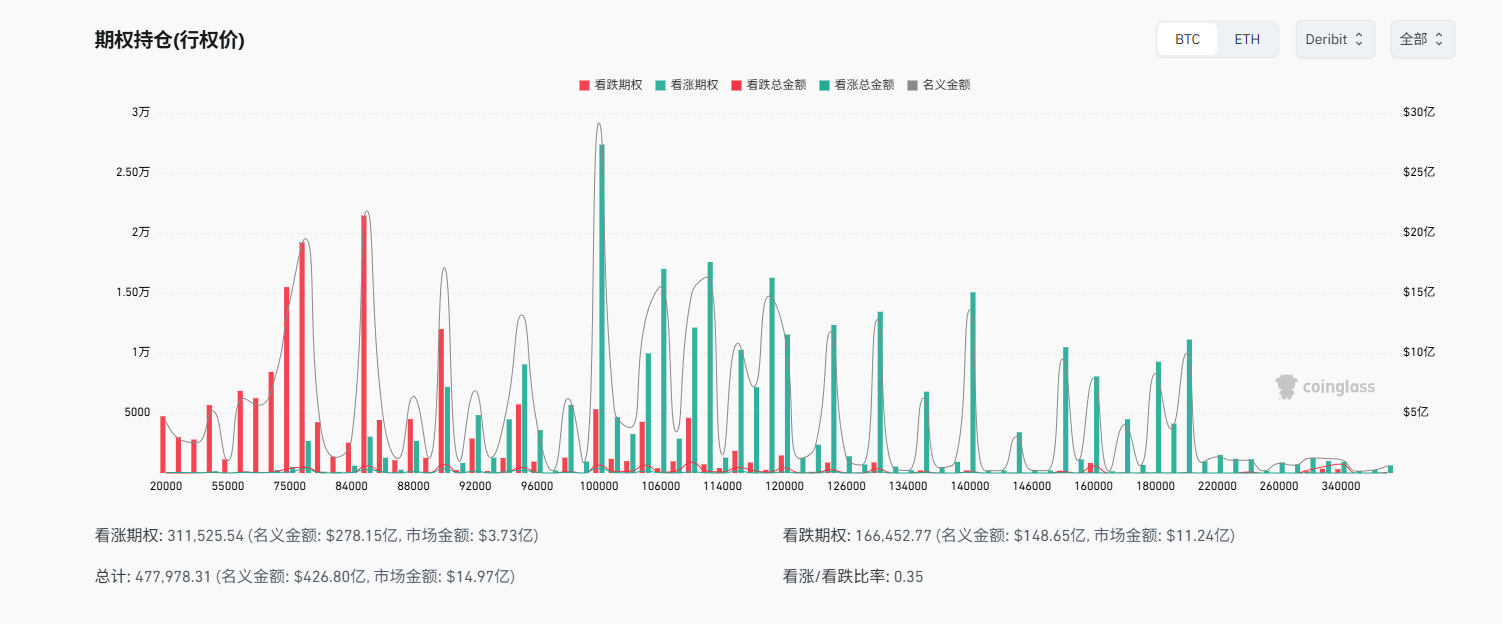
Further dissecting the distribution of options strike prices reveals that the vast majority of call options are clustered above the $100,000 mark, rendering their exercise on December 26 highly improbable. These call options, despite their large quantity, appear to be speculative “lottery tickets.” Conversely, a substantial volume of put options is concentrated at strike prices of $85,000 and below. The market value of these put options totals $1.124 billion, dwarfing the $373 million market value of call options (representing premiums paid by investors). In essence, while more individuals may hold bullish positions, a significantly larger pool of capital (approximately 75%) is actively betting on or defending against a market downturn.
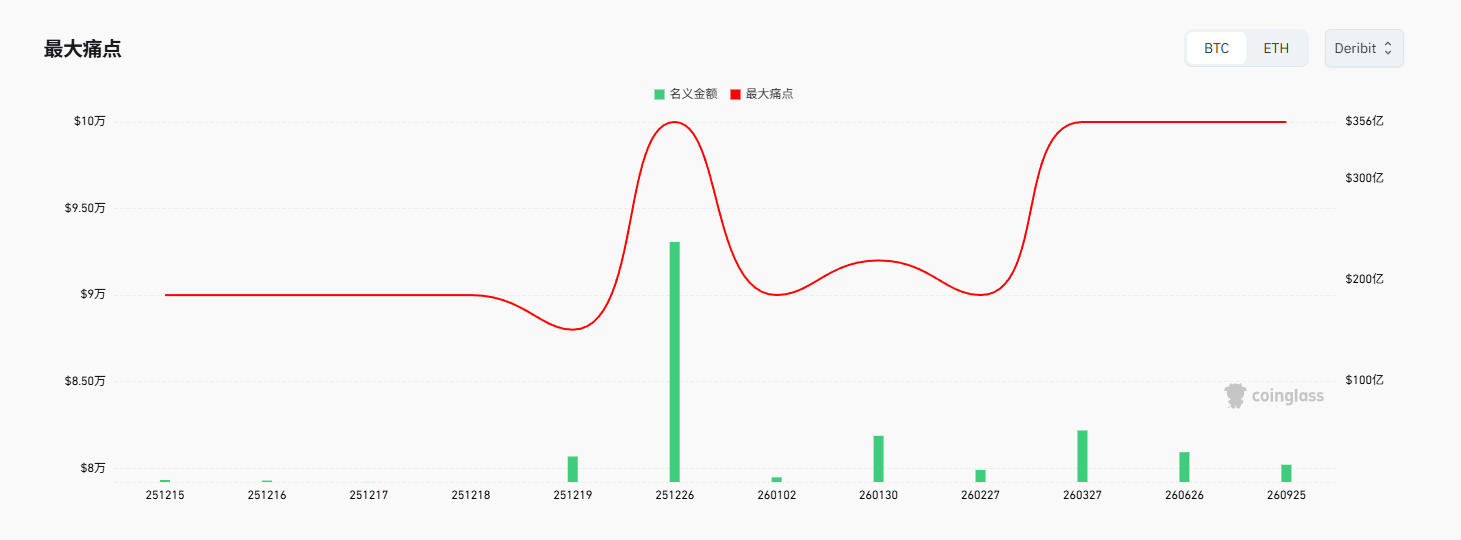
The current “maximum pain” point is pegged at $100,000, suggesting this price level will be a key battleground for options sellers and buyers this month. Market makers, typically options sellers, are likely the predominant bullish force, poised for significant gains if the price can be nudged towards $100,000.
However, for institutions heavily invested in put options, their primary motivation is often to hedge against downside risk in their spot holdings. While their bearish stance is largely defensive, their willingness to allocate substantial capital to expensive put options strongly indicates a pronounced pessimistic outlook on future market trends.
Stablecoins: Regulatory Retreat, Speculative Capital on Standby
Beyond options and order book data, stablecoin metrics, particularly exchange flows, offer crucial insights into current market liquidity and direction. Here, too, a pronounced market divergence is evident.
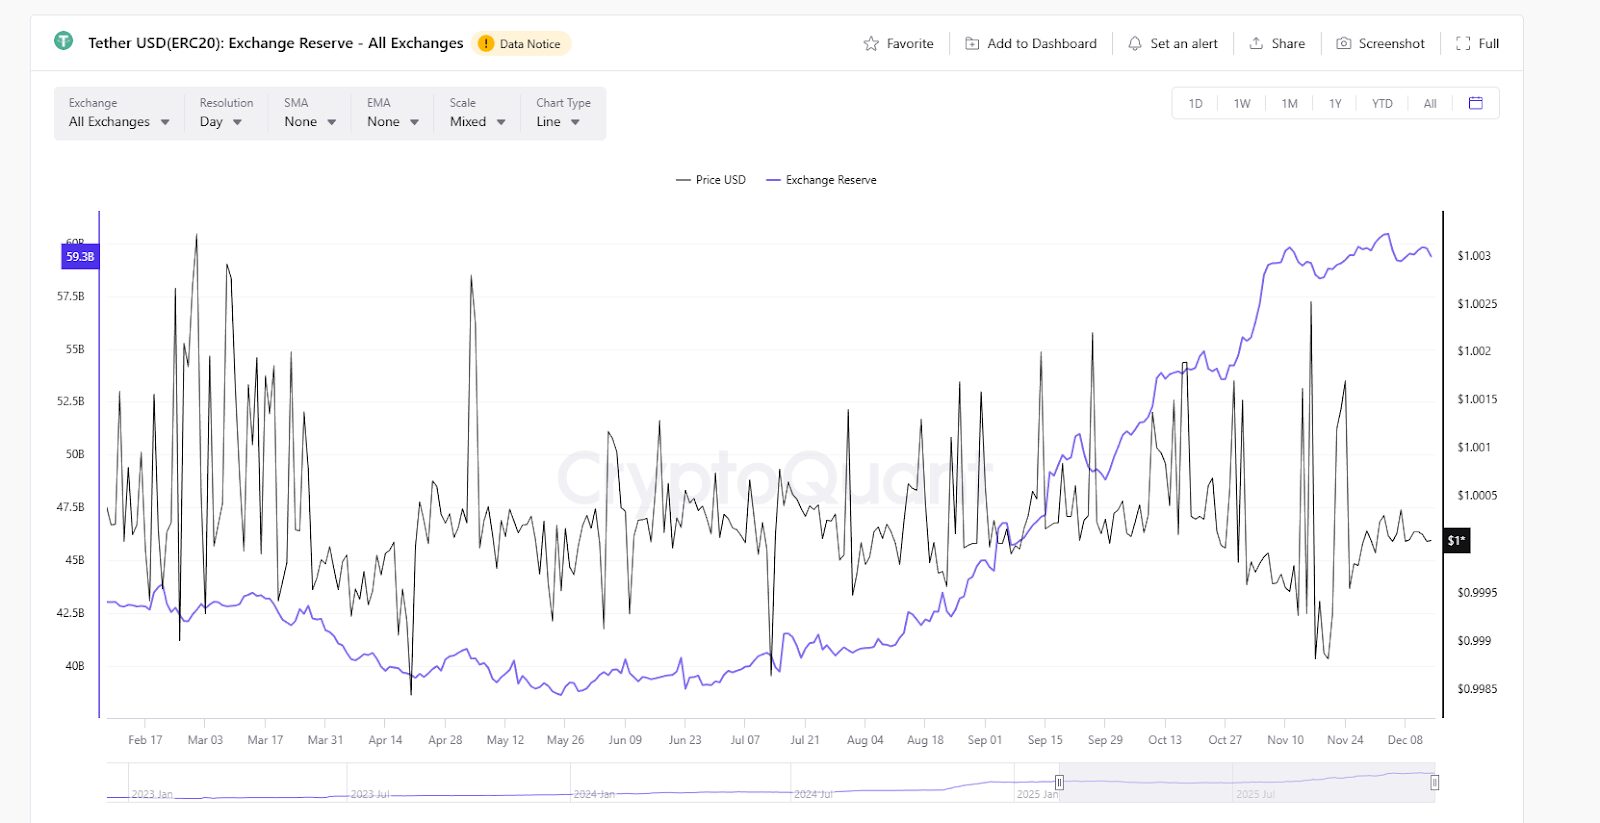
According to CryptoQuant, USDT exchange reserves have maintained an upward trajectory throughout the year, recently hitting an all-time high of $60.4 billion on December 4, and currently stabilizing around $60 billion. As a primary pricing benchmark for non-compliant exchanges, the sustained growth in USDT reserves signals that a substantial volume of speculative capital remains engaged, either actively betting or poised for a dip-buying opportunity. This, coupled with declining open interest, suggests a significant portion of speculative capital is in a wait-and-see mode.
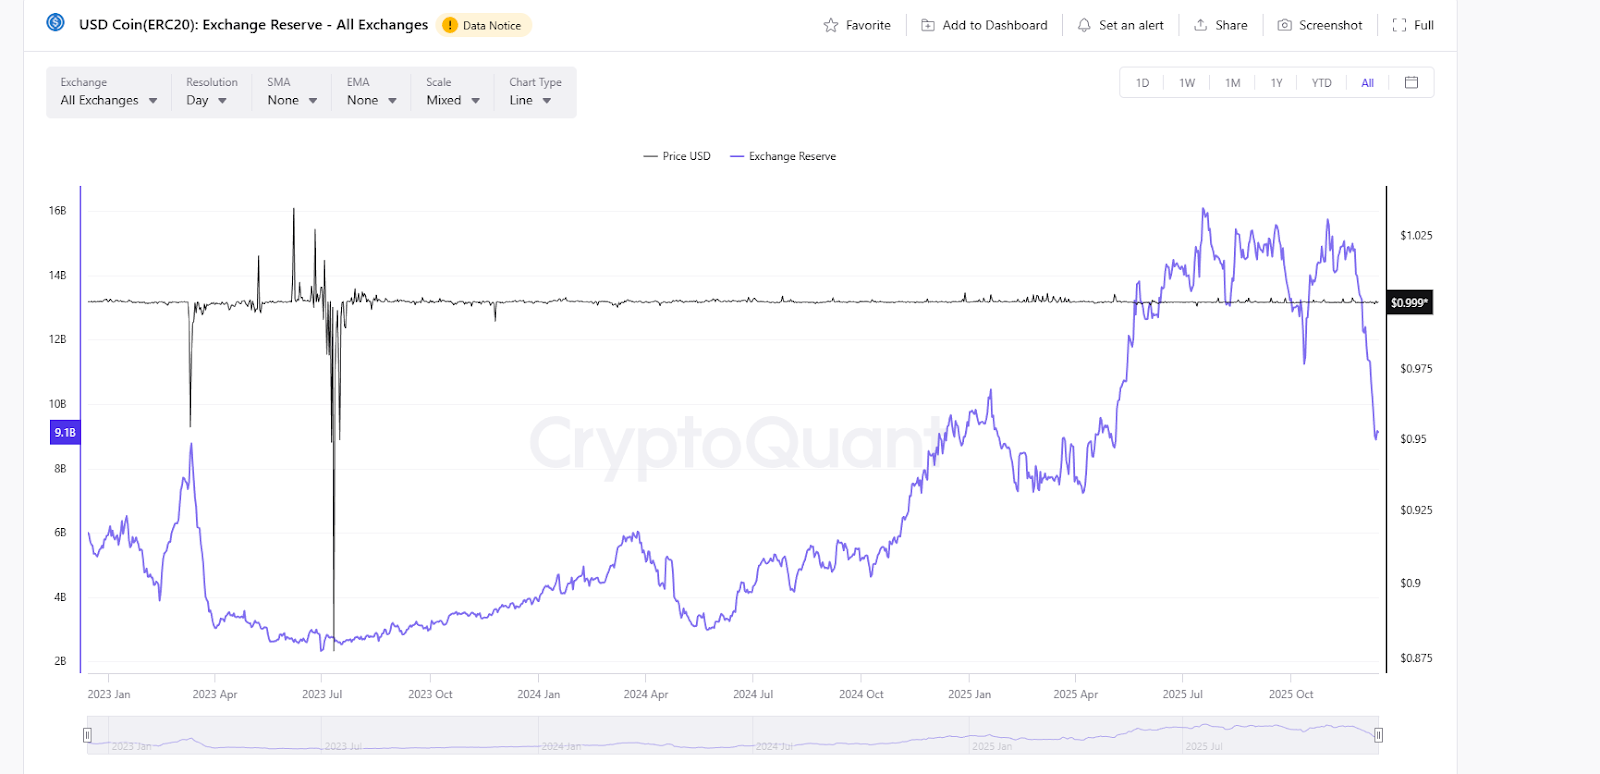
USDC, however, presents a contrasting narrative. Since late November, a considerable exodus of USDC from exchanges has been observed, with reserves plummeting by 40% from $15 billion to approximately $9 billion. As the leading compliant stablecoin, USDC’s user base predominantly comprises U.S. institutions and regulated funds—the institutional representatives of the market. Their accelerated withdrawal clearly indicates a significant reduction in institutional exposure.
This contrasting movement—USDT inflows versus USDC outflows—points to a market where retail investors and speculative capital are awaiting buying opportunities, while compliant institutions are actively de-risking. This conclusion aligns perfectly with the insights gleaned from the BTC options market. Alternatively, a portion of this stablecoin shift could represent funds hedging against downside risk by converting crypto assets into stablecoins.
While numerous other market indicators exist, the overarching consensus drawn from our analysis remains consistent: the market has not genuinely recovered from the October 11 downturn. Instead, we observe a landscape characterized by scarce liquidity and a significant schism between institutional and retail participants. Retail investors and speculative capital are holding their ground, observing from the sidelines, while compliant institutions and major funds are accelerating their exit from the spot market and simultaneously constructing robust short defenses in the options market by paying substantial premiums.
The current market environment does not resemble a bottom poised for a strong rebound. Rather, it appears to be a defensive struggle, marked by “institutional retreat and speculative maneuvering.” In this context, pragmatism dictates focusing on whether the institutional defense line at $85,000 is breached, rather than optimistically anticipating a breakthrough towards $100,000.
(The above content is excerpted and reproduced with authorization from our partner PANews, original link)
Disclaimer: This article is for market information purposes only. All content and views are for reference only and do not constitute investment advice. They do not represent the views and positions of BlockTempo. Investors should make their own decisions and trades. The author and BlockTempo will not bear any responsibility for direct or indirect losses resulting from investor transactions.