
Many seasoned market observers have long noted the multi-year price “cycles” that appear to govern Bitcoin’s trajectory, often aligning with its programmatic halving events. These recurring patterns, collectively dubbed the “4-year cycles,” have become a foundational psychological touchstone for crypto enthusiasts and traders alike. This article delves into the distinct phases of these cycles, reviews their historical manifestations, and critically examines the pressing question: are Bitcoin’s iconic cycles still relevant in today’s evolving market?
The Anatomy of a Typical 4-Year Bitcoin Cycle
Market analysts generally describe a standard Bitcoin cycle as commencing with an “accumulation” phase. This period typically follows a significant price crash from the previous cycle’s peak. Characterized by relatively low price volatility and subdued on-chain activity, market sentiment often hovers between neutral and negative. It’s during this time that long-term Bitcoin holders strategically accumulate, leading to a gradual, yet often overlooked, price recovery. Retail investors, still reeling from the previous downturn, tend to remain on the sidelines.
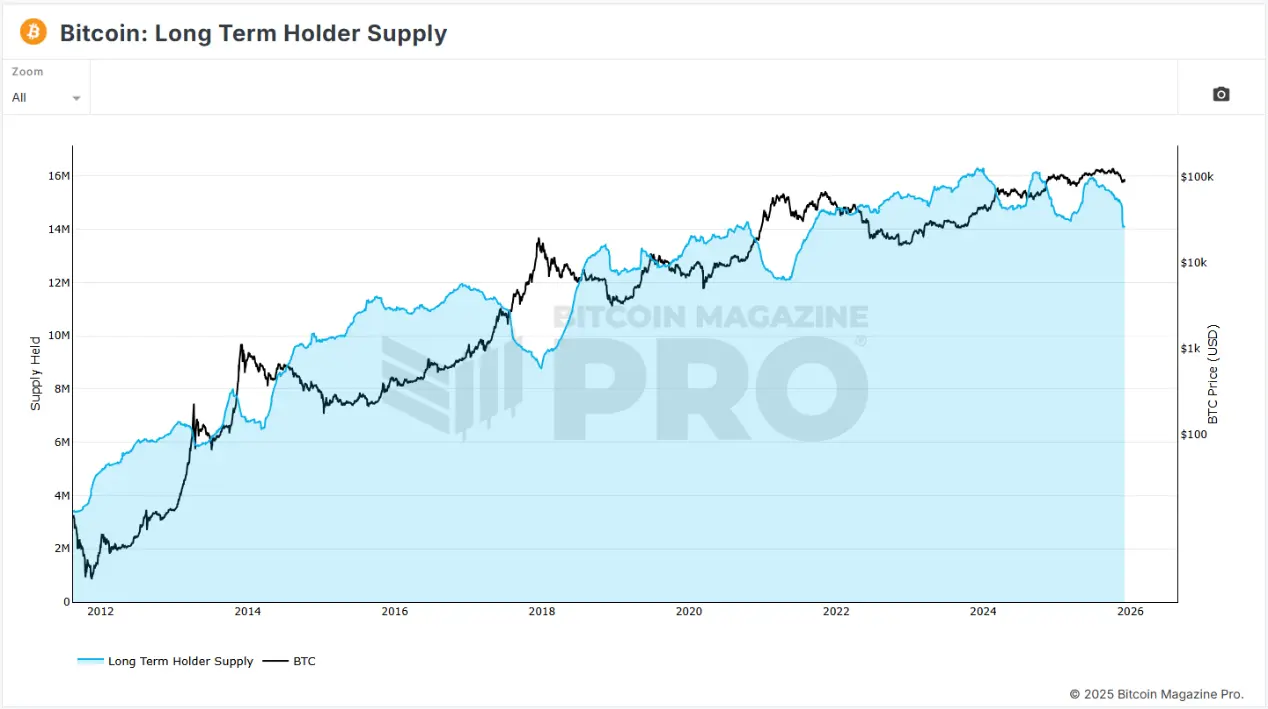
On-chain analytics often reveal a steady hoarding by a segment of investors, even as the broader retail market remains hesitant to re-engage after prior losses.
This accumulation phase typically spans 12 to 15 months, after which the market usually transitions into a new bull run. This often precedes the halving event, as Bitcoin and other crypto assets begin to appreciate in anticipation of the impending supply reduction. The market starts to price in the future scarcity, and sentiment gradually shifts from neutral to overtly optimistic. Liquidity flows back into the ecosystem, accompanied by a surge in media attention.
Once the halving occurs, the bull market frequently enters a parabolic surge, with prices climbing, sometimes steadily, sometimes explosively. Retail investors pour into the market, and traders deploy significant capital. Historically, this phase has often seen Bitcoin reach new all-time highs as a fresh wave of investors enters the fray. The pursuit of higher prices can lead to increased leverage, intensifying price volatility.
Previous bull markets have typically lasted around 12-18 months, often culminating in a sharp price correction. Leveraged traders face liquidation, altcoins experience even steeper declines, and sentiment turns overwhelmingly negative, marking the onset of a bear market. In this phase, many participants capitulate, selling at a loss and exiting the market with remaining capital. Eventually, the dust settles, and a market bottom slowly forms. Overall market activity and excitement significantly diminish from the peak, yet dedicated builders persist, quietly advancing new products and innovations.
Understanding the Halving Mechanism
To fully grasp the theory of Bitcoin’s 4-year cycles, one must first comprehend the concept of the halving and its profound impact on Bitcoin’s price dynamics.
A Bitcoin halving is a pivotal event where the reward for mining new blocks (paid in BTC) is cut in half. This occurs approximately every 210,000 blocks, which translates to roughly every four years. Starting in 2009 with a reward of 50 BTC per block, there have since been four halvings. The 2024 halving reduced the mining reward to 3.125 BTC per block. Assuming the four-year rhythm continues, halvings will proceed until Bitcoin reaches its hard cap of 21 million coins, estimated to be around the year 2140.
The halving mechanism was Satoshi Nakamoto’s ingenious way of ensuring Bitcoin’s scarcity. Born during the 2008 financial crisis, Bitcoin was partly conceived as a response to the unchecked money printing and inflation caused by central bank bailouts. Most governments and their associated fiat currencies constantly adjust monetary policy, making it challenging for holders to maintain long-term confidence in their currency’s value.
Bitcoin’s halving mechanism mirrors the scarcity of gold; just as gold becomes harder to extract as mines deplete, Bitcoin achieves this mathematically. As the rate of new Bitcoin supply decreases, its inherent scarcity increases. Historically, Bitcoin’s price has tended to rise following each halving, a direct consequence of supply-demand economics. Consequently, many proponents argue that the transparency and consistency of the halving make Bitcoin a compelling asset with robust store-of-value capabilities.
A Retrospective: Bitcoin’s Past Cycles
The 2013 Cycle: The Genesis of Digital Gold
Emerging from its 2008 inception, 2013 marked Bitcoin’s first discernible cycle. This era was predominantly driven by early tech communities, including online forums and cryptography meetups. It also garnered initial media attention, with stories often revolving around groundbreaking events like the first real-world Bitcoin transaction (10,000 BTC for two pizzas) and speculative questions like, “Is Bitcoin digital gold?”
During this formative cycle, Mt. Gox stood as the dominant Bitcoin exchange, handling over 70% of global Bitcoin transactions in 2014. However, the subsequent collapse of Mt. Gox in 2014, following the suspension of trading and the revelation of 850,000 lost BTC, severely eroded market trust. This catastrophic event, given Mt. Gox’s role as a primary liquidity provider, triggered an 85% price decline and ushered in a prolonged bear market.
The 2017 Cycle: The Rise of Retail and ICO Mania
The 2017 cycle was defined by Bitcoin’s burgeoning popularity among retail investors. The launch of Ethereum in 2015 brought smart contracts and their revolutionary potential into public consciousness. Ethereum’s native token, Ether (ETH), surged from $10 to $1,400 during this period. This era also became synonymous with the Initial Coin Offering (ICO) craze, where thousands of ERC-20 tokens were launched, often attracting investment based solely on a whitepaper.
Bitcoin’s price exploded from $200 to $20,000 within two and a half years, fueled by a massive influx of new investors. The industry frequently captured mainstream media headlines. Ultimately, the very ICO boom that propelled Bitcoin’s dramatic rise also served as a catalyst for its eventual crash. Many project teams, having accumulated substantial amounts of ETH and BTC, began selling these tokens for fiat currency, creating immense selling pressure. Concurrently, the U.S. SEC initiated a severe crackdown on ICOs, labeling many as “unregistered securities offerings” and filing lawsuits against numerous projects, many of which were exposed as Ponzi schemes or outright scams. In this environment, over-leveraged investors either panic-sold or were forced to liquidate their holdings as prices plummeted, leading to an 84% crash for Bitcoin, reaching a low of $3,200.
The 2021 Cycle: Macro Asset and Institutional Influx
Bitcoin’s 2021 cycle coincided with unprecedented monetary expansion during the COVID-19 pandemic. Governments worldwide, eager to revitalize economies stalled by lockdowns, deployed massive fiscal stimulus. This surge in global liquidity propelled Bitcoin to new all-time highs. This cycle was also notable for Bitcoin’s transformation from a niche “internet money” into a more significant “macro asset.” Companies like MicroStrategy and Tesla acquired billions of dollars worth of Bitcoin for their balance sheets, while payment applications such as PayPal and CashApp began integrating Bitcoin transactions. The DeFi boom of 2020 and the NFT craze of 2021 further attracted a vast wave of retail participation. Both retail and institutional investors collectively drove cryptocurrency prices, with Bitcoin peaking at nearly $69,000.
The end of this cycle was precipitated by the spectacular collapse of several prominent protocols and companies within the industry. First, the Luna stablecoin UST de-pegged, wiping out $60 billion in a matter of days. Companies and institutions like Voyager, Celsius, BlockFi, and Three Arrows Capital, with direct or indirect exposure to Luna, aggressive market bets, and interconnected liabilities, subsequently declared bankruptcy. BlockFi, which had undergone restructuring and received a credit line from FTX, ultimately collapsed with the unraveling of FTX itself.
The FTX exchange and its affiliated trading platform Alameda were exposed for massive fraud, leading to forced asset liquidation to repay users. Adding to the market’s woes, the U.S. Federal Reserve concluded its stimulative monetary policy and began aggressive interest rate hikes, effectively draining liquidity from the market. All these converging events contributed to Bitcoin’s dramatic price crash, reaching a bear market bottom of $15,500.
The 2025 Cycle: Institutional Dominance and New Frontiers
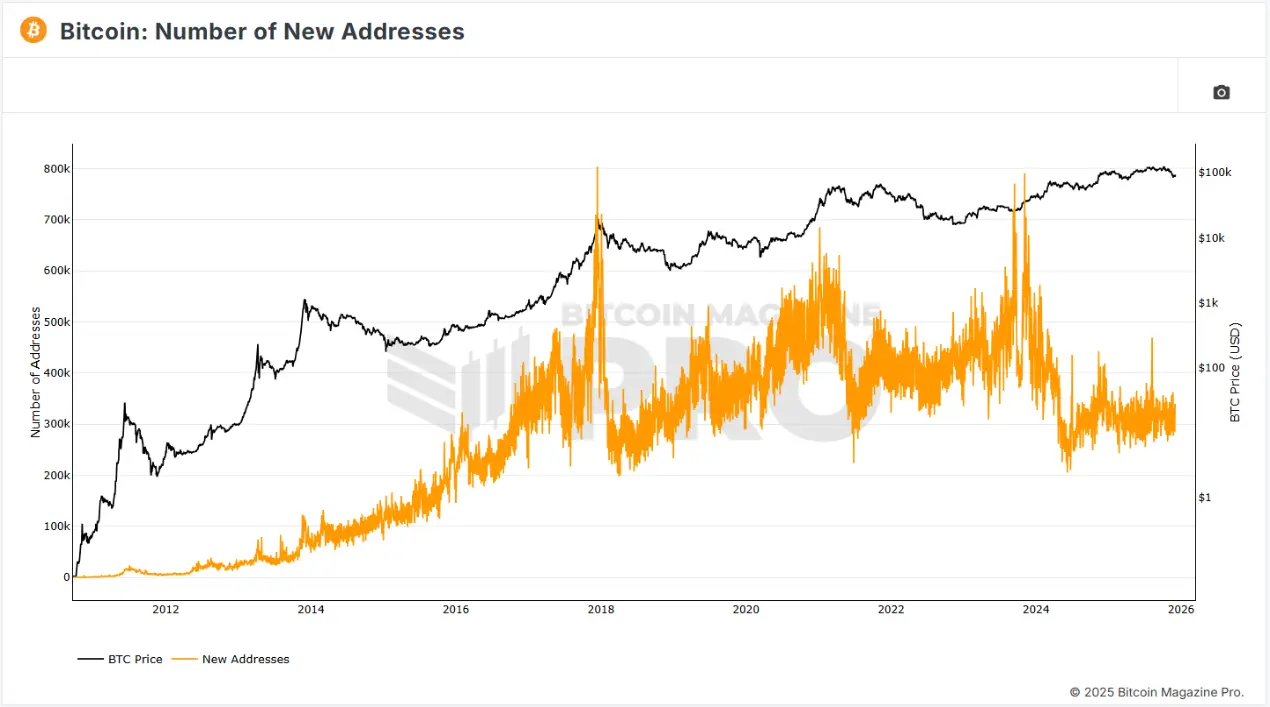
The current 2025 cycle is characterized by a significant surge in institutional adoption, with major traditional financial institutions making their foray into the space. The approval of spot Bitcoin ETFs in January 2024 saw firms like BlackRock, Fidelity, and VanEck begin offering Bitcoin as a standard investment product. Many corporations are also emulating MicroStrategy’s Digital Asset Treasury (DAT) model, incorporating cryptocurrencies onto their balance sheets. This cycle stands out for Bitcoin reaching a new all-time high of $73,000 in April 2024, *before* its halving event. Furthermore, institutions have emerged as the primary price drivers, while retail participation has yet to reach the levels observed in previous cycles.
Deconstructing the Drivers: Why Do Bitcoin Cycles Occur?
The Stock-to-Flow Ratio
Several potential explanations underpin the occurrence of Bitcoin’s 4-year cycles. A commonly cited theory relates to the Stock-to-Flow (S2F) ratio, a model traditionally used to quantify the scarcity of commodities like gold and silver.
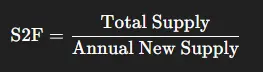
This model compares the existing supply (stock) to the annual new supply (flow). A higher ratio indicates greater scarcity. S2F is applied to Bitcoin due to its fixed total supply and the predictable issuance of mining rewards. With each halving, Bitcoin’s stock-to-flow ratio effectively doubles, as the rate of new supply is halved. Currently, Bitcoin’s S2F ratio is approximately 110, significantly higher than gold’s ratio of around 60, positioning Bitcoin as a demonstrably scarcer asset under this model.
Psychological Factors and Self-Fulfilling Prophecies
Another straightforward explanation involves market psychology and the phenomenon of self-fulfilling prophecies. Bitcoin’s price is profoundly influenced by narratives, herd behavior, and future expectations. Unlike traditional financial assets with inherent intrinsic value, Bitcoin’s valuation largely hinges on collective anticipation of its future worth. Consequently, Bitcoin’s price is highly reflexive, making it particularly sensitive to halving expectations, rumors, and prevailing narratives. Because the 4-year Bitcoin cycle has played out consistently multiple times, investors tend to trade based on the patterns of previous cycles, thereby creating a self-reinforcing prophecy.
Global Liquidity Dynamics
Others argue that Bitcoin’s cycles are primarily dictated by shifts in global liquidity. Arthur Hayes, co-founder of BitMEX, posited in his essay “Long Live The King” that Bitcoin’s 4-year cycles are directly correlated with global liquidity, specifically highlighting the influence of the US Dollar and Chinese Yuan. Hayes explained that the 2013 peak was driven by post-2008 money printing, the 2017 peak by the depreciation of the Japanese Yen against the US Dollar, and the 2021 peak by post-COVID monetary expansion.
Recently, discussions around the end of Quantitative Tightening (QT – where the Federal Reserve reduces assets on its balance sheet, thereby decreasing liquidity), the potential restart of Quantitative Easing (QE), and declining interest rates have led some to suggest that the 2025 Bitcoin cycle may deviate significantly from historical patterns.
The Retail vs. Institutional Divide
The differing behaviors of retail and institutional holders also play a crucial role in driving Bitcoin cycles. Institutional investors are typically more disciplined, possess longer investment horizons, and tend to buy during periods of panic, thereby helping to establish market bottoms. Retail investors, conversely, are often more emotionally driven, susceptible to FOMO (Fear Of Missing Out), and more likely to chase price momentum and utilize leverage. Consequently, retail participation tends to amplify volatility within cycles, particularly during their later stages.
Are Bitcoin Cycles a Relic of the Past?
Several compelling arguments suggest that Bitcoin’s cyclical nature might be evolving or even becoming obsolete. A significant factor is the increased institutional participation through avenues like ETFs, corporate treasuries, and hedge funds. These sophisticated financial entities operate differently from individual retail investors, often buying on fixed schedules, employing reasonable leverage, and meticulously managing risk. This disciplined behavior inherently dampens volatility, potentially smoothing out traditional cyclical swings.
Another potential reason lies in the cryptocurrency market’s significant maturation since its earlier cycles. Bitcoin is increasingly becoming intertwined with broader macroeconomic factors such as interest rates and Federal Reserve policy, which could diminish the singular impact of the halving on its price. While halvings occur on a predictable four-year schedule, Federal Reserve policy lacks such a fixed timetable. Furthermore, the inherent significance of the halving itself is gradually decreasing as its impact on block rewards lessens; the first halving cut rewards from 50 BTC to 25 BTC, whereas the most recent halving reduced them from 6.25 BTC to 3.125 BTC, a smaller proportional change.
Indicators: How to Discern the End of a Cycle
Closely monitoring the developments of the current cycle can offer valuable insights into whether the 4-year pattern is indeed becoming a historical artifact. Key indicators that might signal such a shift include:
- Absence of a Post-Halving Price Surge: Previous cycles typically witnessed a parabolic price rally following the halving, usually within 12-18 months. A sustained lack of such a surge could indicate a change.
- Lack of Massive Leverage Clear-Outs: Past cycles have consistently concluded with widespread leverage liquidations and cascading failures, leading to price drops exceeding 70%. If future downturns are less severe or driven by different mechanisms, it could signify a new market structure.
- Perfect Alignment with Global Liquidity: If Bitcoin’s price movements begin to perfectly mirror shifts in global liquidity, it would reinforce its status as a macro asset rather than one primarily governed by its halving schedule.
- Subdued Retail Participation and Altcoin Performance: Previous cycles saw a dramatic surge in retail engagement and parabolic rallies in altcoins during their later stages. Insufficient retail participation in the current or future cycles might suggest that institutional buying is dominating, potentially leading to lower volatility and flatter, less dramatic cycles.
Conclusion
Bitcoin has, for an extended period, adhered to a fascinating 4-year cyclical rhythm: a slow recovery from a bear market, leading into a halving event, followed by a sustained price surge, and ultimately a sharp correction as leveraged positions unwind. Historically, a confluence of factors, from supply-side economics to market psychology, contributed to this familiar pattern. Despite these dramatic swings, Bitcoin has steadily matured, evolving into the formidable $1.8 trillion asset it is today.
The emergence of institutional investors, spot ETFs, and even sovereign wealth funds marks a significant evolution in market participants compared to Bitcoin’s nascent cycles. While Bitcoin appears increasingly sensitive to broader macroeconomic factors, its price movements continue to be influenced by traditional drivers such as market psychology and the unique economics of mining.
It remains unclear whether Bitcoin’s distinct cycles are truly a thing of the past. Each cycle is unique, and it is entirely plausible that future cycles will unfold differently from their predecessors. Understanding the historical evolution of this asset and its participant base is paramount to anticipating future trends. Ultimately, however, only time will tell if this enduring pattern continues to define Bitcoin’s journey or becomes a fascinating relic of its early history.