
As 2025 draws to a close, the cryptocurrency market finds itself at a pivotal juncture. Bitcoin (BTC) has dipped below the $90,000 mark, with the Fear & Greed Index plummeting to 11 (extreme fear). Short-term holder capitulation has reached its second-highest point in history, surpassed only by the 2024 JPY carry trade collapse. The December 10th FOMC meeting concluded as anticipated, with the Federal Reserve (Fed) cutting interest rates by 25 basis points, bringing the federal funds rate to 3.50%-3.75%. However, forward guidance took a hawkish turn, projecting only one rate cut in 2026. This confluence of factors led to BTC breaching the $90,000 threshold, met with a subdued “buy the rumor, sell the news” market reaction.
Paradoxically, the Fed also initiated its “Reserve Management Purchase” (RMP) program, injecting $40 billion monthly in short-term Treasury liquidity. This “non-QE” signal of moderate easing is poised to reshape market dynamics in 2026. As investors face this “year-end reckoning,” the critical question emerges: should one “hold through the holidays” anticipating a potential rebound, or “take profits” to secure gains? This article delves into optimal allocation strategies and the 2026 outlook, integrating FOMC impacts, on-chain data, institutional movements, and historical market patterns.
Decoding the FOMC Decision: A Liquidity Turning Point
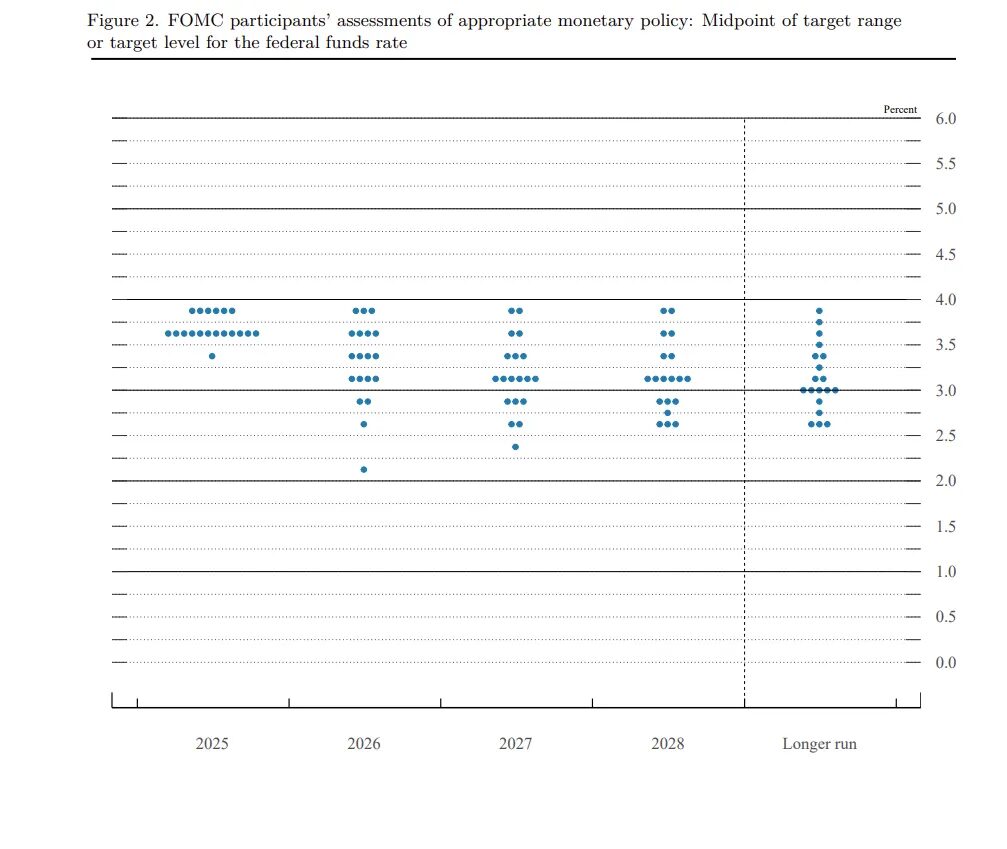
The latest FOMC meeting, the final monetary policy decision of 2025, delivered a nuanced message. While a rate cut passed with a 9:3 vote, the “dot plot” indicated a significant slowdown in the 2026 rate-cutting path, projecting only one 25-basis-point reduction. This narrative reinforces a “hawkish cut,” signaling the Fed’s apprehension regarding inflation resurgence and a soft landing for the job market, hence its reluctance for aggressive short-term easing. With an 89% probability of a rate cut already priced in, BTC saw only minor fluctuations post-event, while ETH consolidated around the $3,000 mark.
The implications for crypto are twofold:
- Short-Term Headwinds: The hawkish guidance amplified risk aversion, preventing BTC from rebounding to the anticipated $94,000 high and instead triggering billions in leveraged liquidations. Thin year-end liquidity, exemplified by a 40-50% drop in perpetual contract holdings since October, combined with Bank of Japan (BOJ) decisions, creates an environment prone to “pump-and-dump” scenarios.
- Long-Term Tailwinds: Quantitative Tightening (QT) officially concluded on December 1st, with the Fed’s balance sheet beginning to recover after shrinking from $9 trillion to $6.5 trillion. The RMP program acts as “stealth QE,” projected to inject trillions of dollars in liquidity throughout 2026, driving a re-evaluation of risk assets. Historically, liquidity inflection points have often triggered crypto rallies, as seen with BTC’s surge following the Fed’s pivot in 2024. Furthermore, explosive global M2 money supply growth, a weakening DXY US Dollar Index, and stimulus policies from China and the EU are expected to further channel funds into risk assets.
The FOMC decision underscores a “macro-dominated” narrative, suggesting that crypto’s trajectory is now intertwined with broader equity and AI asset performance, rather than solely driven by internal cycles. While short-term volatility intensifies, the impending liquidity injection sets the stage for 2026.
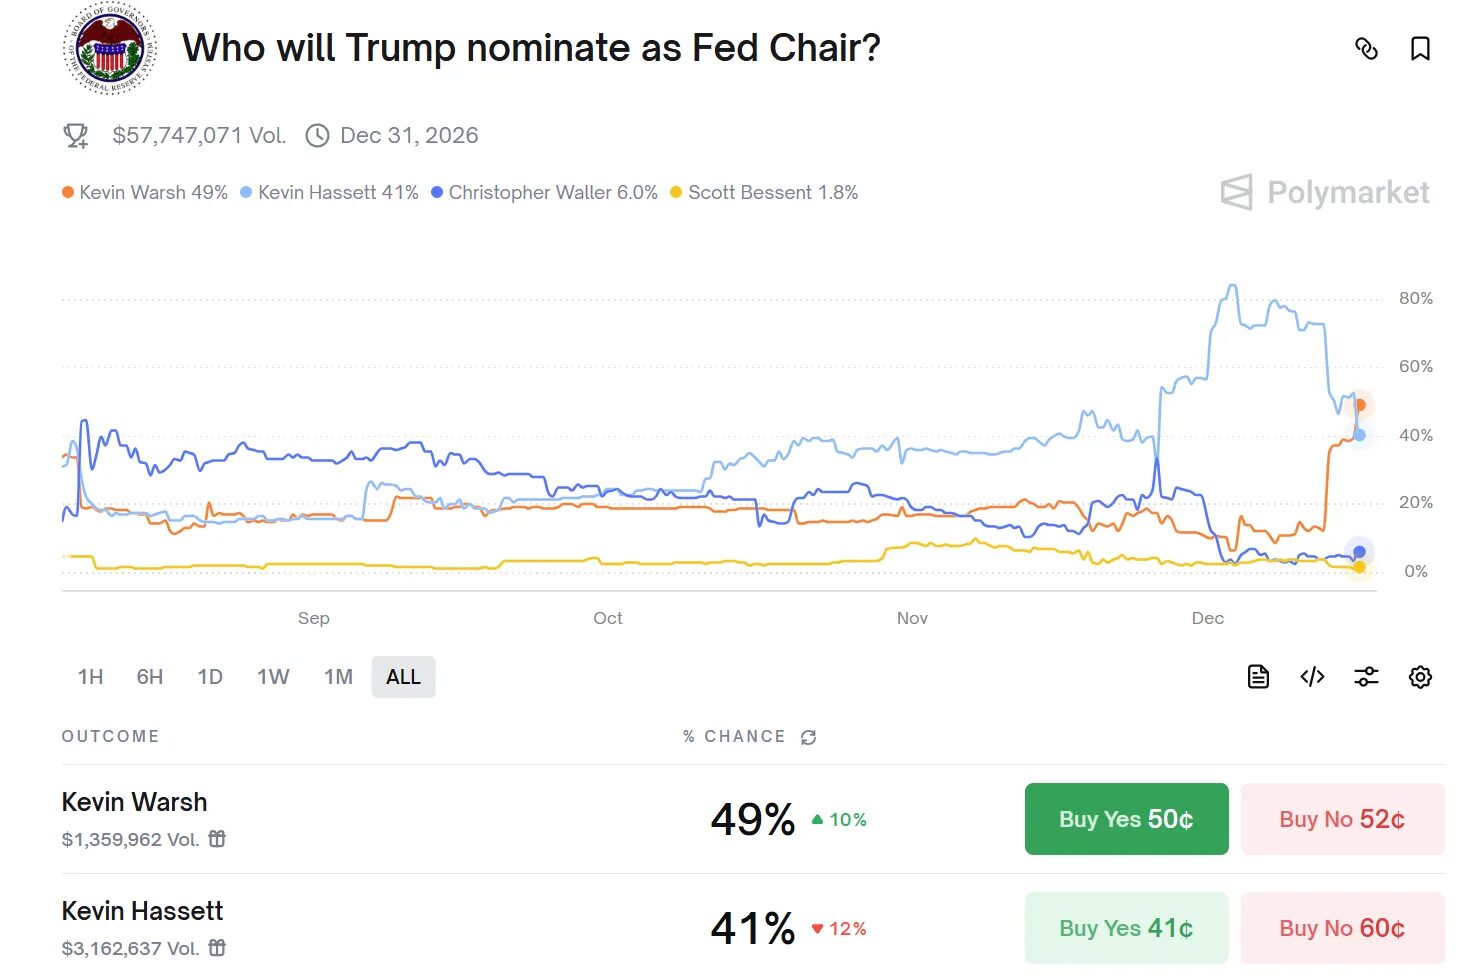
The appointment of a new Federal Reserve Chair will also be a critical variable for the 2026 liquidity landscape. Jerome Powell’s term as Chair officially concludes in May 2026 (though his Board of Governors term extends to January 2028). President Trump has indicated he will announce a successor nomination in early 2026. Current front-runners include “the two Kevins”: Kevin Hassett, Director of the National Economic Council (advocating for more aggressive rate cuts), and former Fed Governor Kevin Warsh (who recently visited the White House, emphasizing consultation on presidential interest rate views).
The installation of a more Trump-aligned, dovish Chair could significantly bolster the 2026 rate-cutting trajectory and accelerate liquidity injections. This, in resonance with the RMP program and potential national Bitcoin reserves, could further enhance confidence in risk assets.
Institutional Foresight: 2026 Positioning – From Defensive to Structural Engagement
The year 2025 is widely recognized as the “Year of Crypto Mainstreaming,” where institutional entry transcended experimental ventures to become a systemic transformation. According to a16z’s “2025 State of Crypto Report,” traditional financial giants like Visa, BlackRock, Fidelity, and JPMorgan Chase have fully launched crypto products, while tech-native innovators such as PayPal and Stripe are bolstering their payment infrastructure. This signifies a profound paradigm shift from “retail-dominated” to “institution-led” markets. A joint survey by EY-Parthenon and Coinbase reveals that 83% of institutional investors plan to expand their crypto allocations in 2025, with DeFi exposure projected to surge from 24% to 75%, focusing on derivatives, lending, and yield-generating opportunities.
Institutional Allocation Trends: Beyond BTC to Diversified Portfolios
- BTC Remains Core, But Share Declines: Bitcoin continues to anchor institutional positions as “digital gold” (ETF AUM exceeding $168 billion, accounting for 60-80% of institutional crypto exposure). However, institutions increasingly view BTC as a low-correlation diversification tool rather than a singular speculative asset.
- Expansion into ETH, Altcoins, and Emerging Assets: Institutions are actively increasing their exposure to Ethereum (attracted by staking yields), Solana (due to high TPS and institutional partnerships), stablecoins (as payment infrastructure), and Real World Assets (RWAs) through tokenization. A Coinbase report indicates that 76% of institutions plan to invest in tokenized assets by 2026, with a focus on tokenized Treasuries, private equity, and bonds, offering instant settlement and fractional ownership.
- Pension and Sovereign Wealth Funds Tentatively Enter: While often indirect (e.g., the Norwegian fund holding BTC via MicroStrategy), 2026 is anticipated to see more direct allocations of 0.5-3% through ETFs or tokenized instruments. Reports from BlackRock and others highlight that sovereign and pension funds are increasingly recognizing crypto as a long-term diversification hedge, gradually increasing their allocation percentages.
Historical Precedent: The BTC “Lunar New Year Effect”
Drivers Behind the “Christmas Low – Lunar New Year Rebound” Pattern
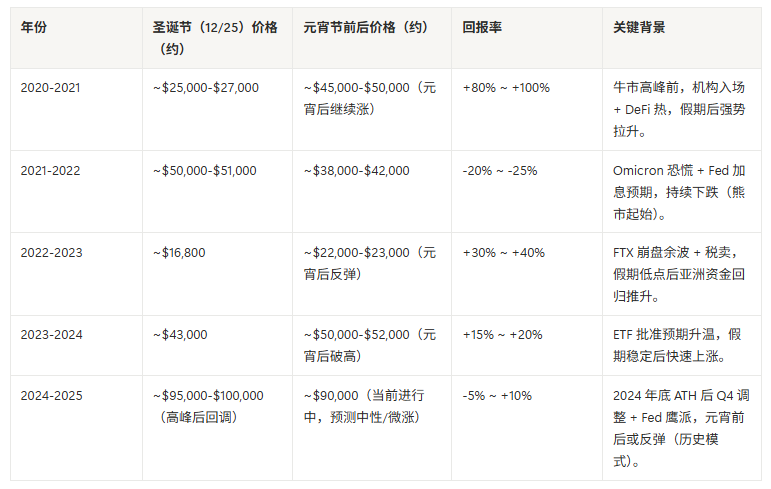
Historical data frequently points to a recurring pattern in Bitcoin’s price action: a “Christmas Low” followed by a “Lunar New Year Rebound.” This phenomenon is driven by several key factors:
- Western Liquidity Drain: From approximately December 20th to early January, Western institutional players enter holiday mode, causing trading volumes to plummet. In such low-liquidity environments, any selling pressure can significantly amplify volatility, often forming a technical bottom.
- Asian Capital Inflow: Around the Lunar New Year period (typically late January to mid-February), regions like mainland China, Hong Kong, and Singapore see the distribution of year-end bonuses and “red envelopes.” This influx of capital often leads retail investors and high-net-worth individuals to increase their allocation to risk assets. Historical data consistently shows a rise in BTC buying volume on major Asian exchanges (e.g., Binance, OKX) in the two weeks leading up to the Lunar New Year.
- Institutional Rebalancing: January marks the start of a new fiscal year for many institutions. Pension funds and hedge funds re-evaluate and rebalance their asset allocations. If BTC demonstrates relative resilience in December (e.g., only a 5-10% pullback in 2025), institutions are often inclined to increase their positions in January to catch up with benchmark returns.
On-Chain Data: A Confluence of Bottom Signals
Following the hawkish FOMC rate cut, the crypto market has entered a characteristic “year-end low liquidity” phase. Bitcoin (BTC) has been oscillating repeatedly within the $88,000-$92,000 range, with the Fear & Greed Index dipping to 25 (extreme fear). While this superficially appears to be a “sell the news” correction, on-chain data reveals deeper structural signals. We’re observing profound capitulation from short-term holders, persistent accumulation by long-term holders, an accelerated outflow of reserves from exchanges, and clear bottoming characteristics across various medium-to-long-term indicators. These data points suggest that the current environment is not merely a bear market but rather a “mid-cycle adjustment and shakeout” phase within a broader bull market.
1. Short-Term Holder (STH) Capitulation: The Pain Nears Its End
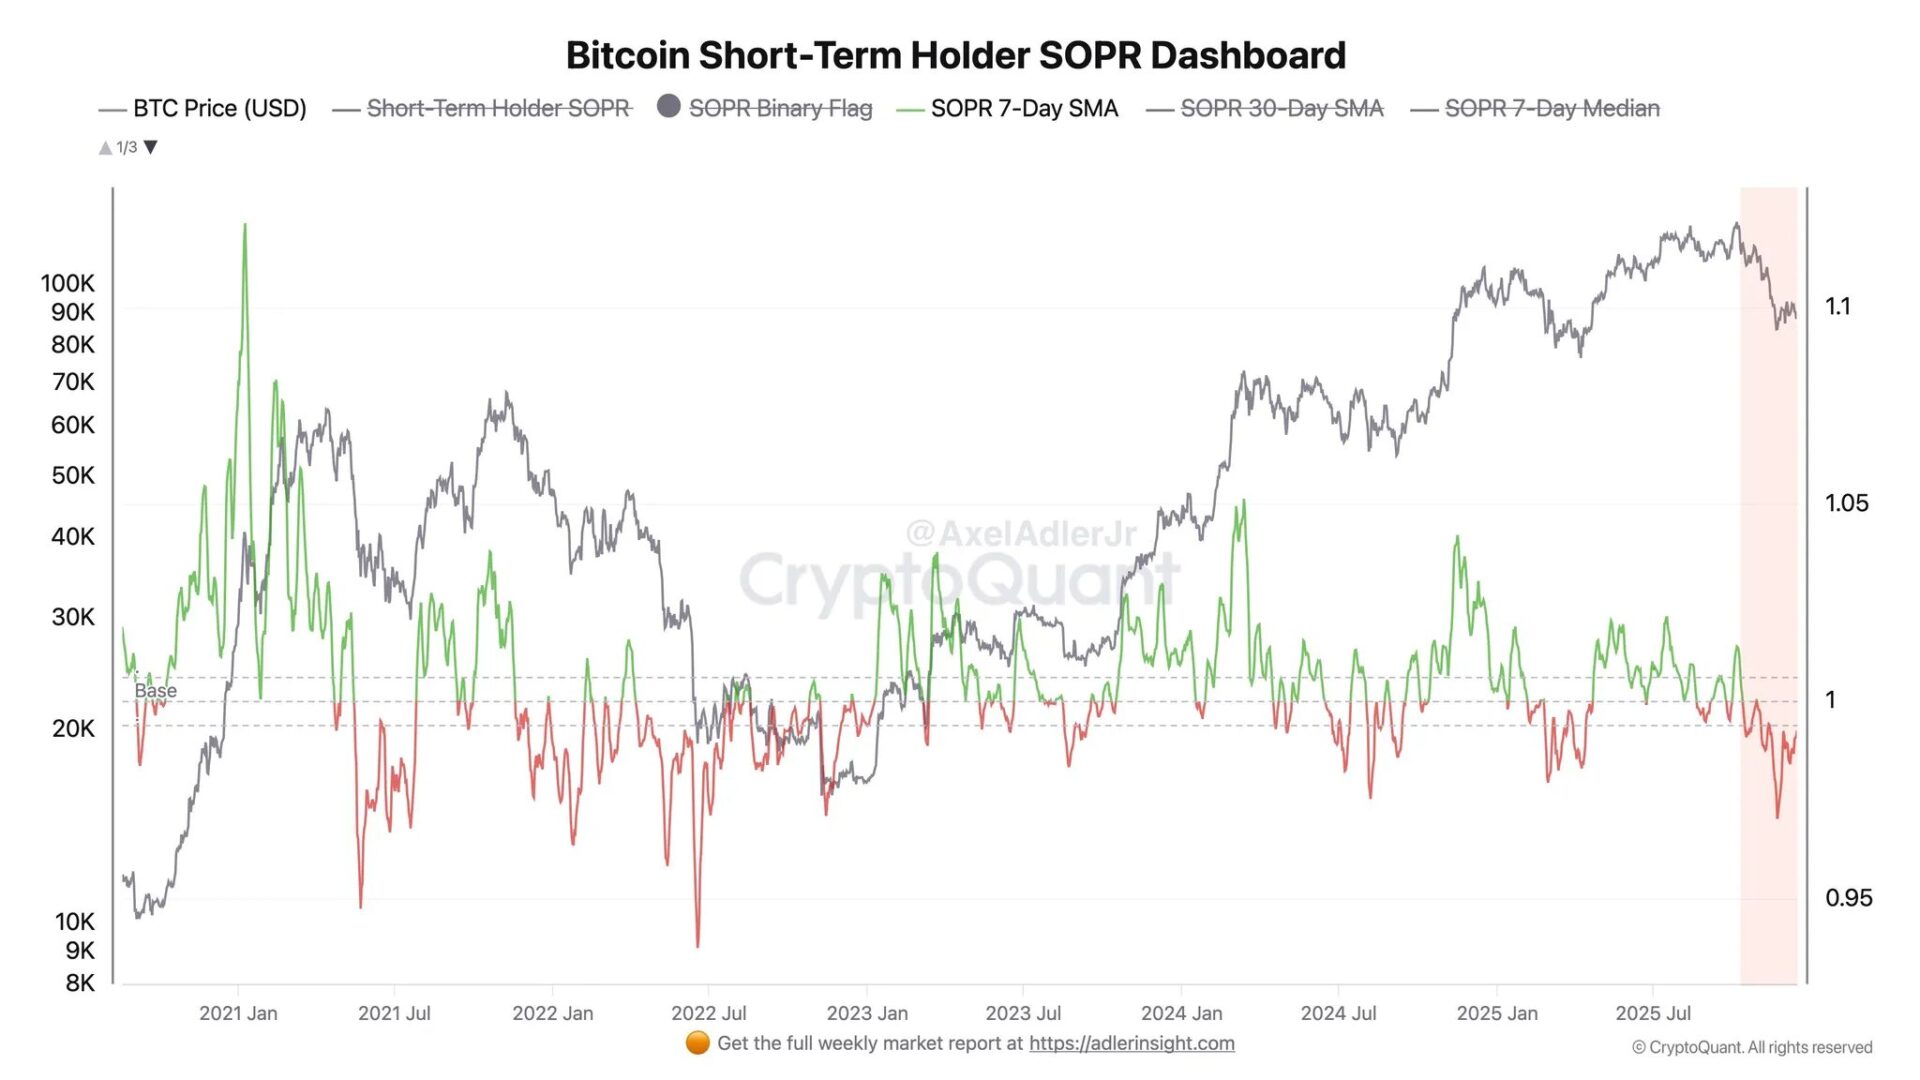
- Realized Losses: Over the past 30 days, short-term holders (those holding for <155 days) have realized losses exceeding $4.5 billion. This figure is second only to the $5.2 billion realized during the JPY carry trade collapse in August 2024 (Glassnode data), indicating a massive surrender by leveraged players and retail investors who bought at highs.
- SOPR Indicator: The Short-Term Holder SOPR (Spent Output Profit Ratio) has consistently remained below 1 (signifying average selling at a loss) for over three weeks. Historically, such deep capitulation phases are often followed by BTC finding a cyclical bottom within 1-3 months.
2. Exchange Reserves and Withdrawals: Strengthening De-platforming Trend
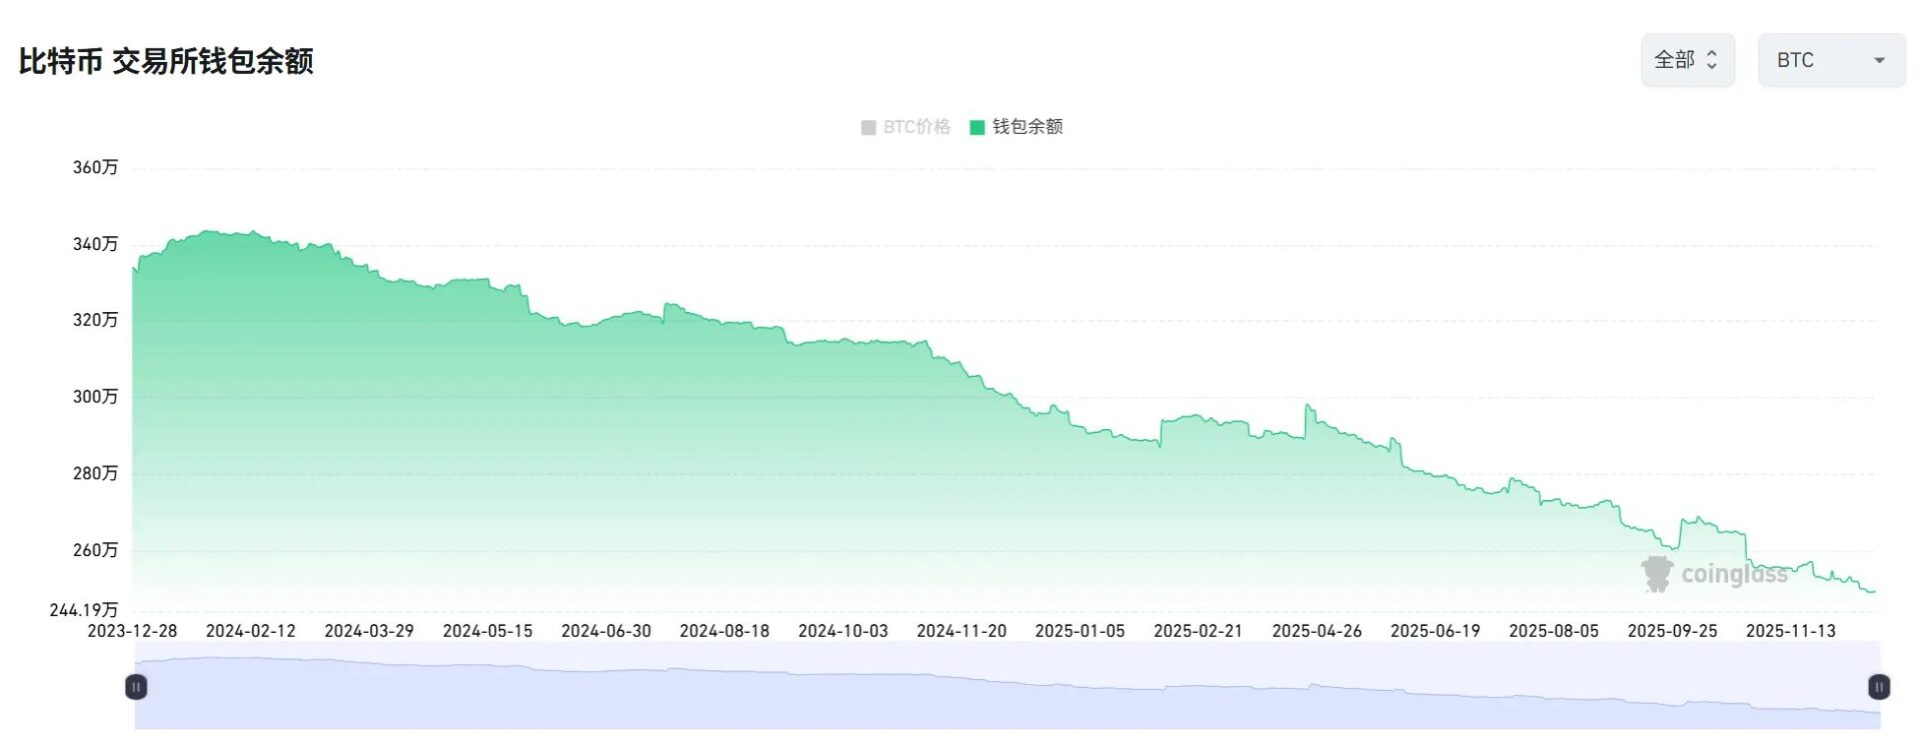
- Exchange BTC Balance: In the last 30 days, total BTC reserves across all exchanges have decreased by approximately 120,000 coins (about 2.5%), falling below 2.6 million BTC (CryptoQuant) – a low not seen since 2018.
- ETH Exchange Reserves: Concurrently, around 1.2 million ETH have been withdrawn from exchanges, with withdrawal speeds reaching a 2025 high. This reflects robust demand for staking and self-custody.
- Stablecoin Reserves: While exchange USDT/USDC balances have seen a seasonal decline, on-chain active addresses and transfer volumes remain stable. This suggests that capital isn’t leaving the ecosystem but is moving into cold storage, awaiting re-entry opportunities.
The outflow of funds from exchanges typically presages a price bottom, simultaneously reducing selling pressure and building momentum for a subsequent rebound.
3. Medium-to-Long-Term Indicators: A Cluster of Bottom Signals
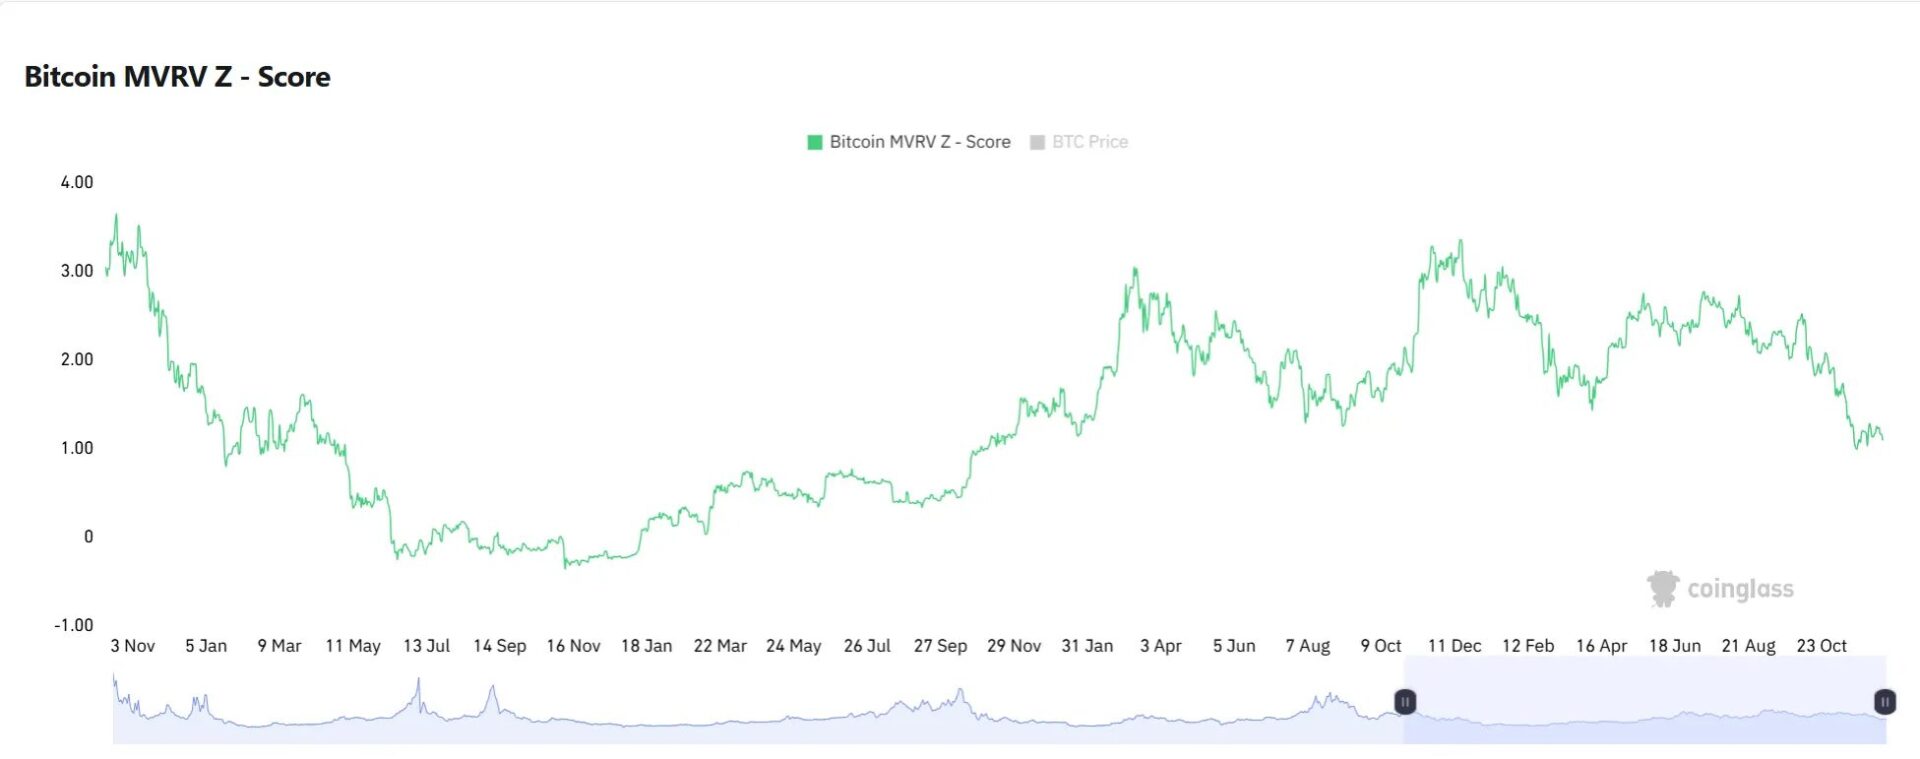
- MVRV Z-Score: Currently at 1.1, this metric has entered the historical “green buy zone.”
- RHODL Ratio: This indicator has fallen to levels last seen during the 2022 bear market bottom, signaling a complete cooling of market euphoria.
- Puell Multiple: The miner revenue indicator has retreated to 0.6. Historically, such lows are often accompanied by a price reversal following miner capitulation.
- Active Addresses and Transaction Volume: Despite short-term sluggishness, the 30-day Moving Average has not experienced a cliff-like drop, distinguishing it from the “activity exhaustion” observed at the 2021 bull market peak.
Allocation Strategy: Navigating Uncertainty for Certainty
The market currently stands at a rare confluence of factors:
- Extreme Short-Term Fear: Market sentiment is in extreme panic (Fear & Greed Index at 25), yet on-chain data presents a dense cluster of bottoming signals.
- Historical Seasonal Support: The “Christmas Low – Lunar New Year Rebound” pattern offers seasonal support, having successfully validated three times in the past five years.
- Impending Macro Liquidity Shift: Macro liquidity is on the cusp of a turnaround (QT concluded, RMP initiated), though short-term pressure persists from hawkish guidance.
- Accelerated Institutionalization: The market structure is transitioning from “speculation-driven” to “allocation-driven.”
For long-term value investors, the current environment offers a relatively clear risk-reward framework: deep capitulation from short-term holders, accelerated outflows from exchanges, persistent accumulation by long-term holders, and valuation metrics like MVRV and RHODL entering historical buy zones. Historically, each time these signals have emerged, they have marked the opening of a medium-to-long-term allocation window. For traders prioritizing liquidity management, the December liquidity crunch presents both risks and opportunities. Maintaining sufficient flexibility, conserving capital during market panic, and strategically acting when the Lunar New Year effect validates itself may prove more prudent than chasing short-term volatility.
(The content above is excerpted and reproduced with authorization from partner PANews. Original Link | Source: WolfDAO )
Disclaimer: This article is for market information purposes only. All content and views are for reference only and do not constitute investment advice. They do not represent the views or positions of BlockTempo. Investors should make their own decisions and trades. The author and BlockTempo will not bear any responsibility for direct or indirect losses incurred by investors’ transactions.