
By Jeff Park (CIO, Bitwise)
Compiled by Dingdang, Odaily Planet Daily
Editor’s Note: On February 5th, the cryptocurrency market experienced another dramatic downturn, witnessing over $2.6 billion in liquidations within 24 hours as Bitcoin briefly flash-crashed to $60,000. Despite the significant event, a clear consensus on its underlying causes remained elusive. Bitwise CIO Jeff Park offers a compelling new analytical framework, focusing on the intricate interplay of options and hedging mechanisms.
Unraveling the Bitcoin Flash Crash: A Deep Dive into Options, Hedging, and Traditional Finance Dynamics
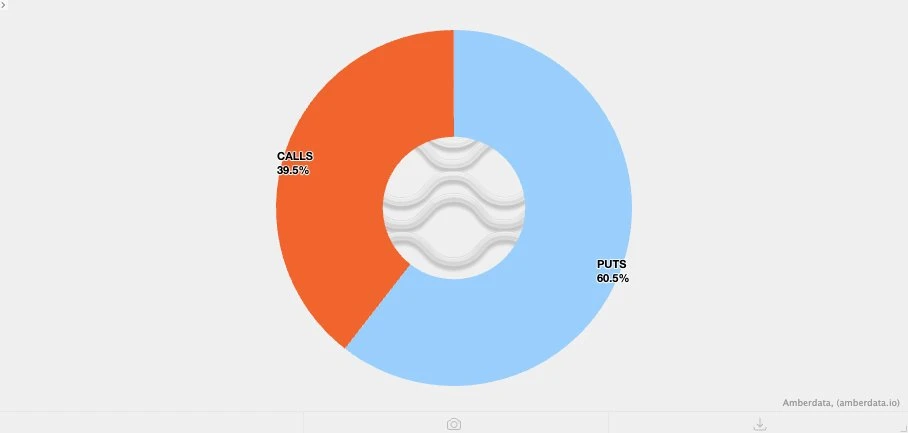
As more data emerges, the picture becomes increasingly clear: this severe market sell-off was likely intrinsically linked to the burgeoning Bitcoin ETF ecosystem, occurring on what was one of the most volatile trading days in recent capital market history. This conclusion is strongly supported by IBIT’s unprecedented trading volume that day, which soared past $10 billion—a staggering twofold increase over its previous record. Simultaneously, options trading volume also hit an all-time high for the ETF since its inception (as illustrated in the charts below).
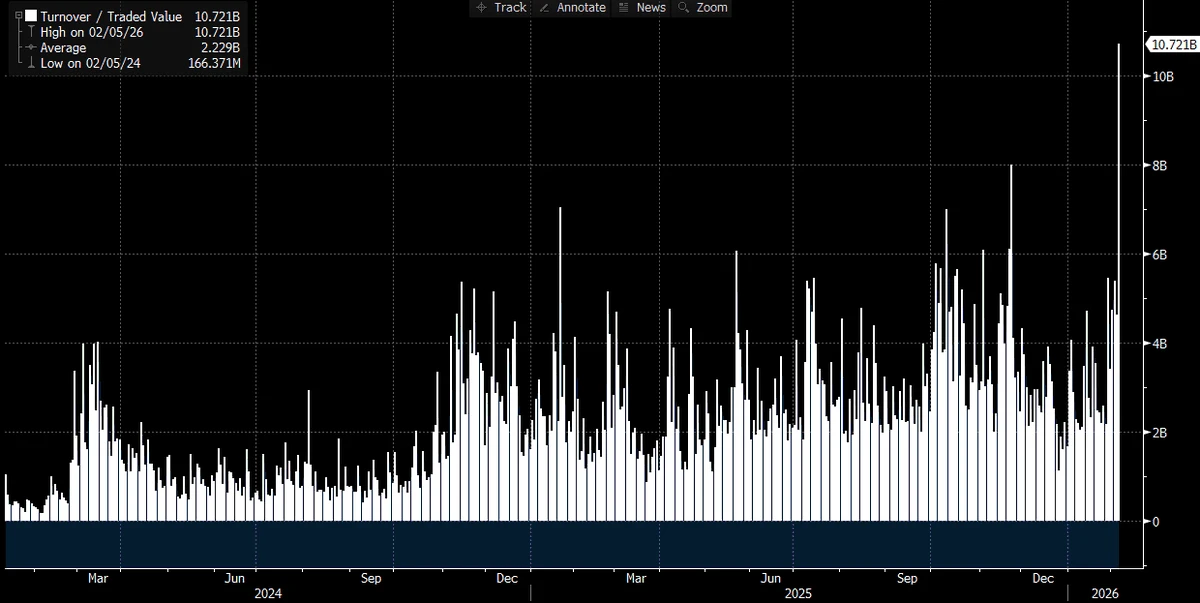
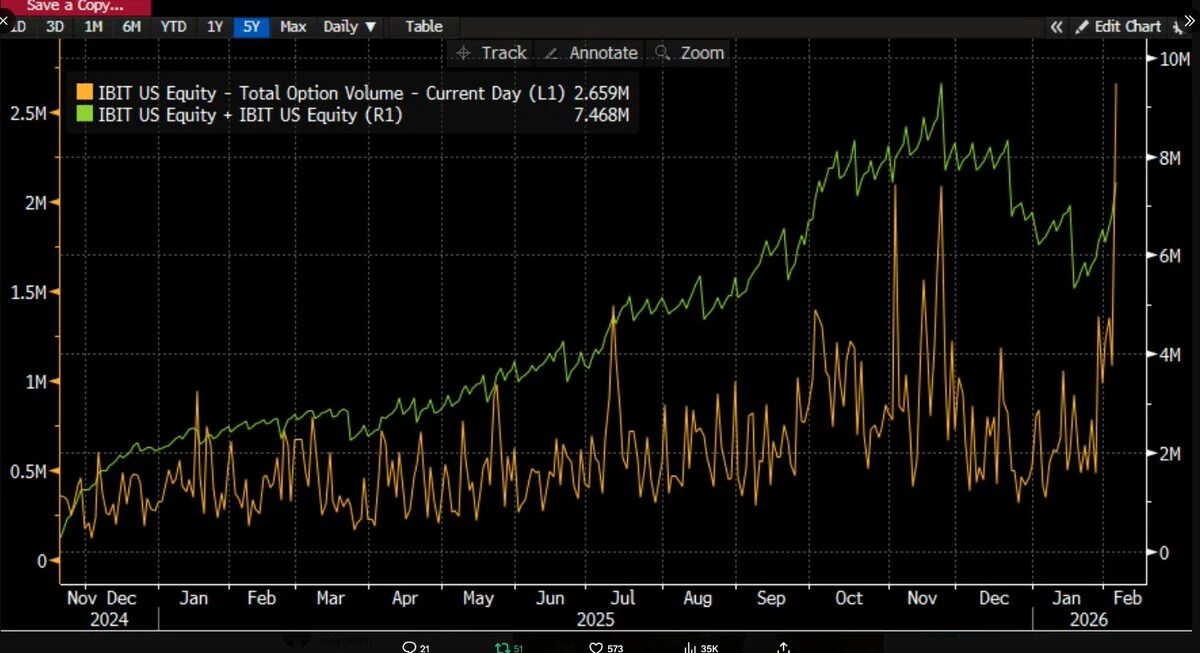
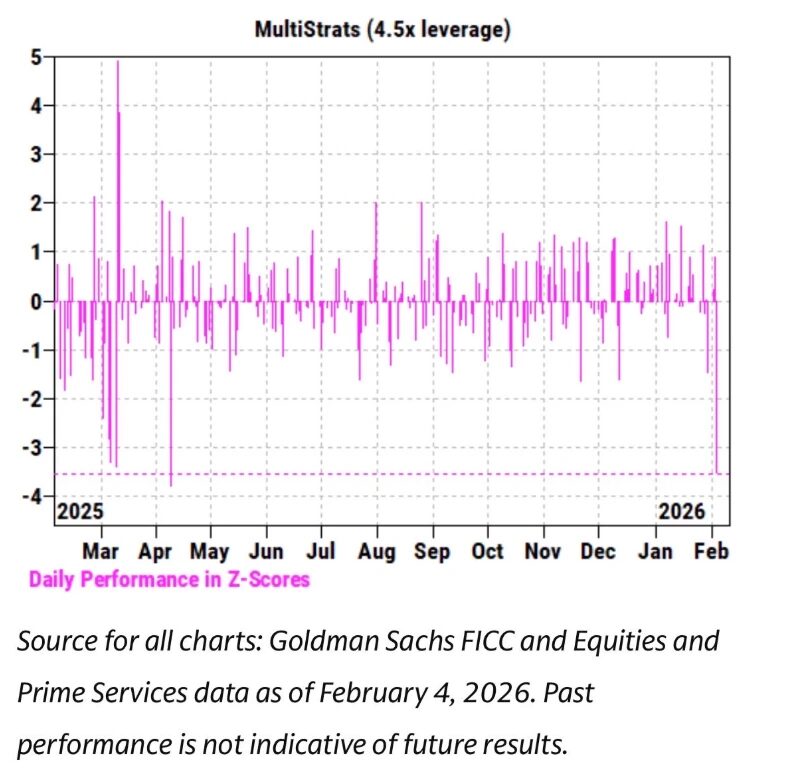
Notably, the structure of this options activity was unusual, with a distinct dominance of put options over calls, signaling a prevailing bearish sentiment (a point we will elaborate on further). Concurrently, over recent weeks, we’ve observed an exceptionally tight correlation between IBIT’s price trajectory and that of software stocks and other risk assets. Goldman Sachs’ Prime Brokerage (PB) team corroborated this, reporting that February 4th marked one of the worst single days for multi-strategy funds in history, evidenced by an alarming Z-score of 3.5. This signifies an extreme, 0.05% probability event, ten times rarer than the classic 3-sigma “black swan” threshold (0.27%). Such a catastrophic shock typically prompts risk managers at multi-strategy funds (often termed ‘pod shops’) to swiftly enforce immediate, indiscriminate, and urgent deleveraging across all trading teams. This imperative action undoubtedly contributed to the widespread market turmoil observed on February 5th.
The Inflow Paradox: A Confounding Market Signal
Given the cascade of broken records and a decisive downward price movement (a 13.2% single-day decline), conventional wisdom would have predicted significant net redemptions from the ETF. Historical precedents support this expectation: for instance, on January 30th, IBIT experienced a record $530 million in redemptions after a 5.8% drop the prior day, and on February 4th, saw approximately $370 million in outflows amidst continuous declines. Therefore, anticipating at least $500 million to $1 billion in outflows on February 5th seemed entirely reasonable.
However, the market defied expectations. Instead, we witnessed widespread net subscriptions. IBIT alone registered an increase of approximately 6 million shares, translating to over $230 million in asset growth. Across the entire Bitcoin ETF ecosystem, total net inflows exceeded $300 million.
This outcome is perplexing. While one might hypothesize that the robust price rebound on February 6th partially mitigated redemption pressures, the leap from “reduced outflows” to “net inflows” is a significant one. This suggests a confluence of complex factors, rather than a simple, linear narrative. Based on the available information, I propose several foundational premises, leading to my overarching deduction:
Firstly, this round of Bitcoin selling likely impacted diversified asset portfolios or strategies that extend beyond purely crypto-native participants. This could include the aforementioned multi-strategy hedge funds or even BlackRock-style model portfolios that dynamically allocate between IBIT and software ETFs like IGV, triggering automated rebalancing under high volatility.
Secondly, the accelerated Bitcoin sell-off was probably linked to the options market, particularly downside-oriented option structures.
Thirdly, the sell-off did not culminate in significant capital outflows from Bitcoin itself. This implies that the primary market movers were within the “paper money system,” characterized by position adjustments led by dealers and market makers who typically maintain hedged exposures.
Jeff Park’s Core Hypothesis: A Multi-Layered Deleveraging Event
Building on these premises, my core hypothesis unfolds as follows:
- The immediate catalyst for this sell-off was a broad deleveraging initiated by multi-asset funds and portfolios, triggered when the downside correlation among risk assets reached statistically anomalous levels.
- This process subsequently unleashed an extremely aggressive deleveraging, encompassing Bitcoin exposure. Crucially, a substantial portion of this risk comprised “Delta neutral” hedged positions, such as basis trades, relative value strategies (e.g., Bitcoin against crypto-related equities), and other structures where residual Delta risk is typically managed by the dealer system.
- This deleveraging then ignited a “short Gamma” effect, further intensifying downward pressure and compelling dealers to sell IBIT. The ferocity of the sell-off forced market makers to net short Bitcoin, irrespective of their existing inventory. Paradoxically, this action led to the creation of new ETF inventory, thereby moderating the market’s initial expectations of massive capital outflows.
Subsequently, on February 6th, IBIT experienced positive capital inflows. Some IBIT buyers (the specific nature of these buyers remains a key question) seemingly capitalized on the dip, further offsetting any minor net outflows that might have otherwise occurred.
Deconstructing the Sell-Off: From Software Stocks to Gamma Cascades
I contend that the initial catalyst for this event originated from the sell-off in software stocks, given Bitcoin’s pronounced correlation with software equities—a correlation even stronger than its link to gold. This is visually supported by the charts below:
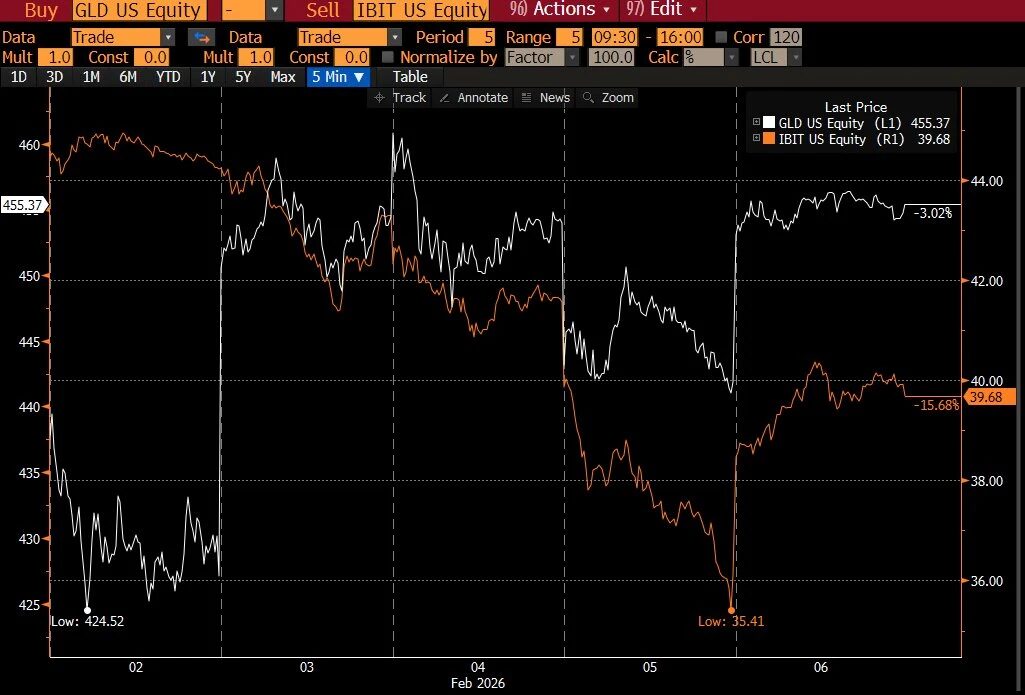
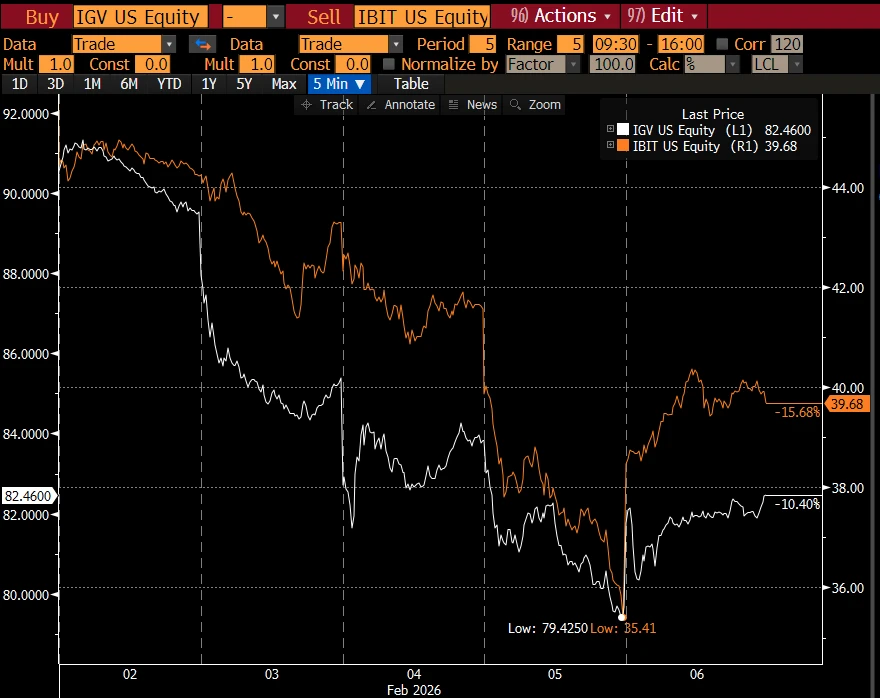
This logical connection is reinforced by the fact that gold is generally not a significant component of multi-strategy funds engaged in financed trades, though it may feature in RIA model portfolios. Therefore, this observation strengthens the argument that the epicenter of this market turbulence likely resided within the multi-strategy fund ecosystem.
This brings us to the second crucial insight: that this intense deleveraging indeed involved hedged Bitcoin exposure. Consider CME Bitcoin basis trades, a long-standing favorite strategy among multi-strategy funds.
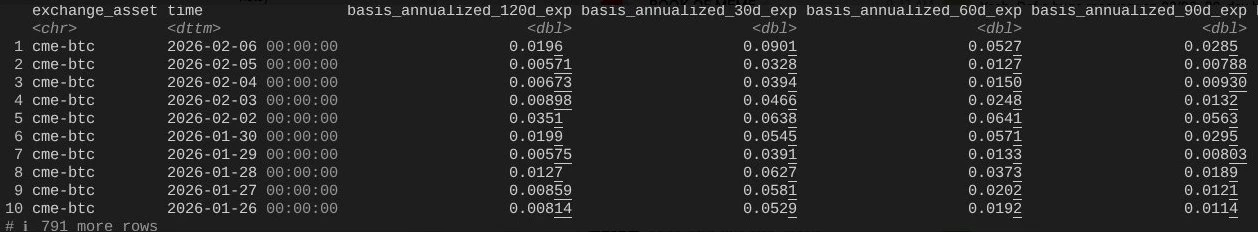
Analyzing the comprehensive CME Bitcoin basis data for 30, 60, 90, and 120-day maturities from January 26th to yesterday (courtesy of @dlawant), it’s evident that the near-month basis surged from 3.3% to a remarkable 9% on February 5th. This represents one of the most significant jumps observed since the ETF’s launch, almost unequivocally pointing to massive, forced liquidations of basis trades. Imagine institutional giants like Millennium or Citadel compelled to unwind basis positions (selling spot while buying futures). Given their substantial presence in the Bitcoin ETF landscape, the profound impact of such operations on overall market structure becomes readily apparent. I have previously detailed my analysis on this very point.
Odaily Planet Daily adds: A significant portion of this indiscriminate domestic U.S. selling likely originated from multi-strategy hedge funds. These funds frequently employ delta-hedging strategies or execute various relative value (RV) or factor-neutral trades, which are currently experiencing widening spreads, potentially exacerbated by spillover from growth equity correlations.
A rough estimate suggests that approximately one-third of Bitcoin ETFs are held by institutional entities, with potentially 50% or more attributed to hedge funds. This represents a substantial pool of “fast money.” Should financing costs or margin requirements escalate amidst heightened volatility, risk managers are quick to intervene, leading to capitulation-style liquidations, particularly when basis yields no longer justify the associated risk premium. Notably, MSTR’s dollar trading volume on that day was among its highest ever.
This phenomenon underscores the notorious “common holder risk” – a primary factor in hedge fund failures: multiple seemingly independent funds holding highly similar exposures. When the market turns downward, everyone simultaneously rushes for the same narrow exit, causing all downside correlations to converge towards 1. Selling into such poor liquidity is a classic “closing risk” behavior, a dynamic we are witnessing firsthand. Ultimately, this will be reflected in ETF flow data. If this hypothesis holds, I anticipate a swift price re-pricing once the liquidation phase concludes, though rebuilding confidence will require some time.
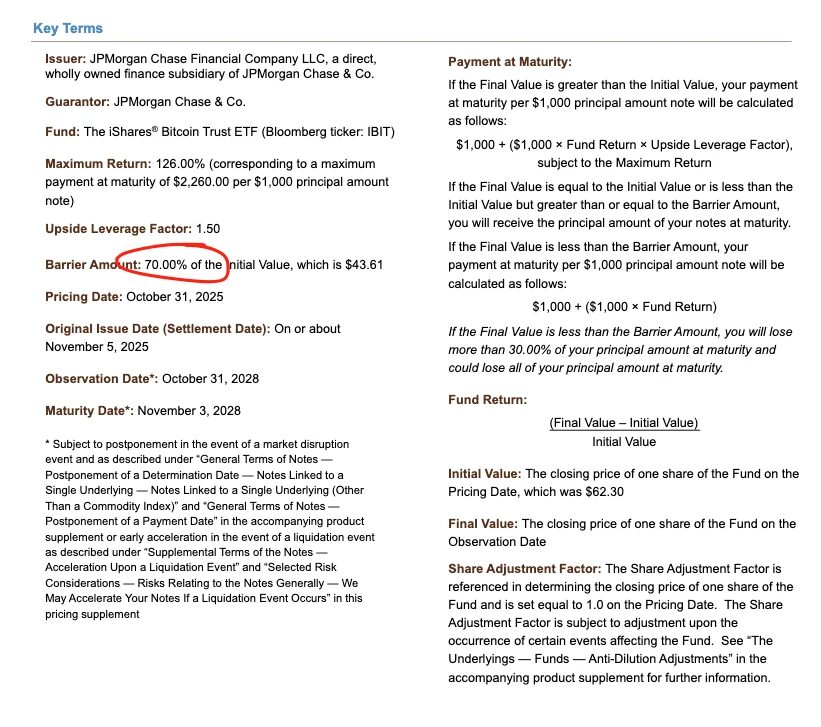
This leads us to the third critical insight: the acceleration of the downside. While the structured products market might not be large enough to trigger such a sell-off in isolation, when all market factors align abnormally and perfectly—exceeding any VaR (Value at Risk) model’s predictions—they can indeed act as acute catalysts for cascading liquidations. This phenomenon immediately brings to mind my experience at Morgan Stanley, where structured products featuring knock-in put barriers (options that become effective only when the underlying asset’s price touches or crosses a specific barrier) often led to highly destructive outcomes. In extreme cases, the change in option Delta could even exceed 1, a scenario not even accounted for in the Black-Scholes model, as standard vanilla options theoretically never see Delta exceed 1.
Consider a note priced by JPMorgan last November, with a knock-in barrier precisely at $43,600. If similar notes continued to be issued in December, and Bitcoin prices subsequently dropped by another 10%, one can envision a significant cluster of knock-in barriers accumulating in the $38,000-$39,000 range—the proverbial “eye of the storm.”
Should these barriers be breached, and if dealers are hedging knock-in risk by selling put options, negative Vanna dynamics would cause Gamma to change with extreme rapidity. In such a scenario, a dealer’s only viable response is to aggressively sell the underlying asset as the market weakens. This precisely matches our observations: implied volatility (IV) collapsed to nearly 90%, approaching catastrophic squeeze levels. Under these conditions, dealers were compelled to expand their IBIT short positions to the extent that they ultimately created net new ETF shares. While this part requires some inferential reasoning and is challenging to fully confirm without more granular spread data, the record trading volume and deep involvement of Authorized Participants (APs) on that day make this scenario entirely plausible.
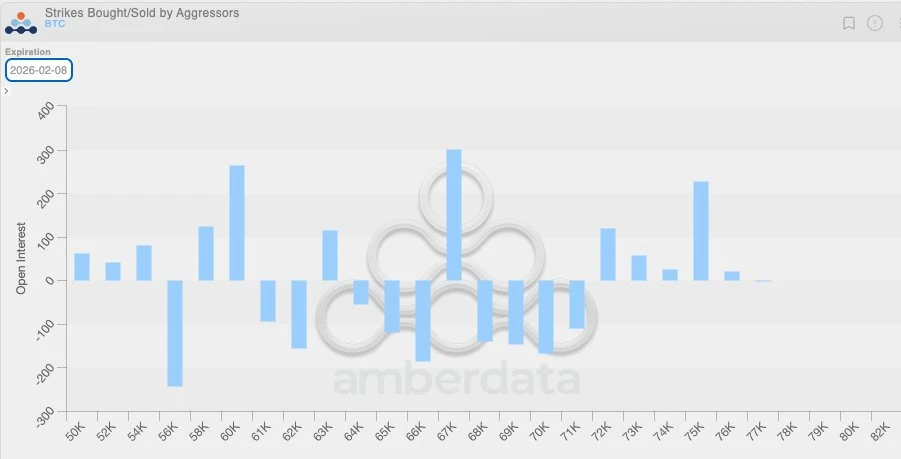
This negative Vanna dynamic gains further clarity when combined with another factor: a period of generally low volatility had led crypto-native clients to predominantly buy put options in recent weeks. This placed crypto dealers in a natural “short Gamma” state, underpricing the potential for significant future volatility. When the actual large move materialized, this structural imbalance further amplified the downward pressure. The position distribution chart below vividly illustrates this, showing dealers heavily concentrated in short Gamma positions for put options within the $64,000 to $71,000 range.
The Swift Reversal: Rebuilding Confidence
This brings us to February 6th, when Bitcoin staged a robust rebound of over 10%. A notable observation from that day was the significantly faster expansion of CME’s Open Interest (OI) compared to Binance’s (special thanks to @dlawant for aligning hourly data to 4 PM ET). A clear collapse in CME OI from February 4th to 5th further corroborates the massive unwinding of basis trades on February 5th. On February 6th, these positions were likely re-established to capitalize on higher basis levels, thereby offsetting the impact of capital outflows.
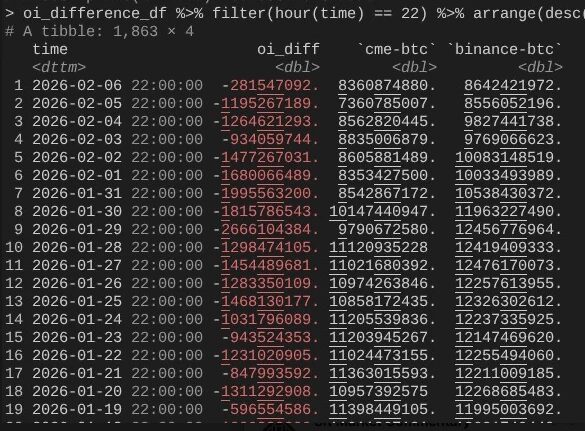
At this juncture, the entire logical chain converges: IBIT’s subscriptions and redemptions largely balanced out because CME basis trades had resumed. However, prices remained depressed due to a clear collapse in Binance’s OI, indicating that a substantial portion of the deleveraging pressure stemmed from short Gamma positions and forced liquidations within the crypto-native market.
Key Takeaways and Future Outlook
This represents my most comprehensive explanation for the market’s performance on February 5th and 6th. While this deduction relies on several assumptions and may not offer a single, clear “culprit” like the FTX incident, its core conclusion is profound: the catalyst for this sell-off originated from de-risking actions within non-crypto traditional finance. This process inadvertently pushed Bitcoin prices into a zone where short Gamma hedging behavior accelerated the downside. Crucially, this decline was not driven by directional bearishness but by hedging demands, ultimately reversing swiftly on February 6th (though this rebound primarily benefited market-neutral funds in traditional finance, rather than crypto-native directional strategies). While perhaps not an exhilarating conclusion, it offers a degree of reassurance: the previous day’s sell-off was likely unrelated to a “10/10” deleveraging event.
Indeed, I do not believe last week’s events were a continuation of a “10/10” deleveraging process. I encountered an article suggesting the turmoil might have originated from a non-U.S., Hong Kong-based fund that failed on a JPY carry trade. However, this theory presents two significant flaws. Firstly, I find it improbable that a non-crypto prime broker would service such a complex multi-asset trade, offer a 90-day margin buffer, and not have already faced insolvency as risk frameworks tightened. Secondly, if carry trade funds were “exiting” by purchasing IBIT options, a drop in Bitcoin’s price alone would not accelerate risk release—these options would simply become out-of-the-money, with their Greeks rapidly approaching zero. This implies the trade itself must have incorporated genuine downside risk. If one were simultaneously long USD/JPY carry and short IBIT puts, such a prime broker, frankly, would not deserve to operate.
The coming days will be pivotal as we await more data to ascertain whether investors are leveraging this dip to establish new demand. If so, this would signal a very bullish outlook. Currently, I am quite optimistic about the potential inflows into ETFs. I remain steadfast in my belief that genuine RIA-style ETF buyers (distinct from relative value hedge funds) are astute investors, and at the institutional level, we are observing substantial and profound progress—a trend clearly evident across the industry and among my colleagues at Bitwise. Therefore, I am particularly focused on net inflows that are not accompanied by an expansion of basis trades.
Ultimately, this entire episode underscores Bitcoin’s increasingly complex and sophisticated integration into global financial capital markets. This also implies that when the market eventually finds itself on the side of a reverse squeeze, the upward rally will be steeper than ever before.
The inherent fragility of traditional financial margin rules serves as Bitcoin’s anti-fragility. Once prices rebound—which I consider inevitable, particularly after Nasdaq’s decision to raise the options open interest cap—the market is poised for an exceptionally spectacular rally.
(The above content is excerpted and reproduced with authorization from partner PANews, original link | Source: Odaily Planet Daily )
Disclaimer: This article is provided for market information purposes only. All content and views are for reference only, do not constitute investment advice, and do not represent the views and positions of Blocktempo. Investors should exercise their own judgment and discretion in trading. The author and Blocktempo shall not be held responsible for any direct or indirect losses incurred by investors as a result of their trading decisions.