
Author: FLAME LABS
Abstract: Navigating Bitcoin’s Q1 2026 Bottom Amidst a Paradigm Shift
This comprehensive research report delves into the critical question facing the Bitcoin market in Q1 2026: Where lies the definitive absolute bottom after a sharp correction from its October 2025 historical peak (approximately $126,000) to the current $60,000-$70,000 range? The market stands at a paradoxical crossroads. On one hand, the traditional “four-year halving cycle” theory suggests a prolonged bear market, potentially requiring a year-long cool-down. On the other, the advent of spot ETFs, a pivotal shift in Federal Reserve monetary policy (compounded by uncertainty from leadership changes), and continuous miner hardware advancements are fundamentally reshaping Bitcoin’s underlying market dynamics.
Rejecting simplistic linear extrapolations, this report constructs a sophisticated five-dimensional valuation model. It integrates macro liquidity, miner survival costs (shutdown prices), on-chain chip distribution (the interplay between Short-Term Holders and Long-Term Holders), technical structure (Volume Profile Visible Range – VPVR and the 200-Week Moving Average – 200WMA), and market sentiment (Fear & Greed Index). Our analysis indicates that while the market may not yet fully satisfy historical “despair phase” duration requirements, the price structure and cost basis suggest the $52,000 to $58,000 range represents a formidable confluence. This zone converges critical miner shutdown prices, the 200-week moving average, and the peak accumulation zone from 2024-2025, thereby constituting the cycle’s extreme value bottom.
Beyond validating the hypothesis of a “$72,000-$52,000 super exchange zone,” this report meticulously details capital behavior within this range. Furthermore, it proposes a probability-based pyramid accumulation strategy, specifically tailored to navigate the complex current macroeconomic environment, particularly the “Warsh Shock” stemming from the Federal Reserve Chair nomination.
1. Macro Narrative Reconstruction: The Four-Year Cycle Under Scrutiny
1.1 The Pitfalls of Historical Extrapolation: Why Past Cycles May Not Predict the Future
The “four-year cycle” theory, rooted in Bitcoin’s halving mechanism, has long been the dominant analytical framework for cryptocurrency assets. This theory, predicated on marginal supply and demand shifts, posits a highly cyclical price rhythm: a fierce bull market one year post-halving, followed by a year-long bear market correction, culminating in two years of consolidation and recovery. Strict adherence to this historical script—a “looking to the past to predict the future” approach—would indeed paint a deeply unsettling picture for the current market stage.
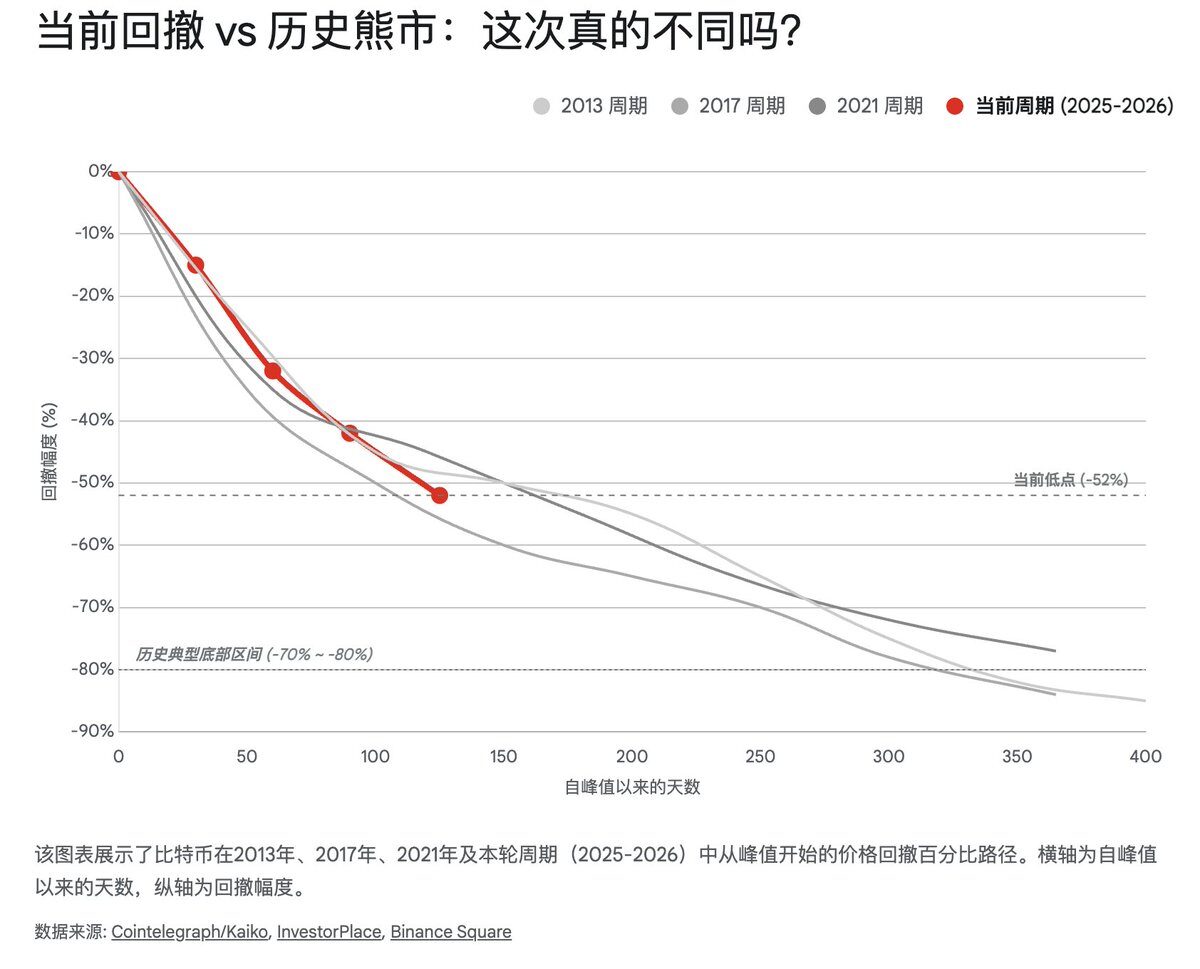
Historical data reveals that post-peak corrections in 2013, 2017, and 2021 bull markets were often characterized by unilateral declines lasting approximately 12 months, with maximum drawdowns typically exceeding 80%:
- 2014-2015 Bear Market: A precipitous 85% drop from $1,100 to below $200, spanning roughly 400 days.
- 2018 Bear Market: An 84% decline from $19,000 to $3,100, lasting approximately 365 days.
- 2022 Bear Market: A 77% fall from $69,000 to $15,500, extending for around 376 days.
As of February 2026, Bitcoin’s price has retreated approximately 52% from its October 2025 peak of $126,000 to around $60,000. Kaiko Research astutely observes that this 52% drawdown appears “abnormally shallow” compared to historical cycles. Should the market strictly align with the intensity of past bear markets, typical bottoms have seen drawdowns of 60% to 68% or even deeper. Mathematically, this implies potential for further downside to $40,000 or below. Furthermore, from a temporal perspective, only four months have elapsed since the October 2025 peak. If the “bear market lasts one year” heuristic holds, the market might require another 4 to 8 months of “grinding” in the bottom region, extending into the latter half of 2026.
However, this straightforward linear extrapolation now faces unprecedented challenges. The current cycle (2024-2026) exhibits significant structural heterogeneity, primarily across two dimensions:
- Institutional Anchoring via ETFs: The approval of US spot Bitcoin ETFs has not only introduced substantial incremental capital but, more critically, has altered the composition of Bitcoin holders. Institutional funds (e.g., holdings by BlackRock’s IBIT and Fidelity’s FBTC) possess greater risk tolerance and longer investment horizons compared to retail investors. Data indicates that even when prices dipped below the ETF average cost basis (roughly $60,000-$64,000), these ETFs did not experience catastrophic net outflows. Instead, they demonstrated a “buy the dip” allocation characteristic. This institutional “support” effect has likely significantly raised the market’s pain threshold, making a repeat of 80%+ crashes less probable.
- Dominance Shift of Macro Factors: As Bitcoin’s market capitalization ascended past the trillion-dollar mark, its asset characteristics have evolved from a purely “alternative speculative asset” to a “macro-sensitive emotional asset.” The correlation between Bitcoin and indices like the Nasdaq, gold, and 10-year US Treasury yields reached historical highs in 2025-2026. This signifies that Bitcoin’s price fluctuations are no longer solely driven by intrinsic halving supply shocks but are increasingly tethered to the gates of global dollar liquidity.
Therefore, pinpointing “where the bottom lies” necessitates a deeper deconstruction of the prevailing macroeconomic variables rather than merely consulting the calendar (time cycle) or the ruler (drawdown magnitude).
1.2 The Warsh Shock: A Macroeconomic Jolt Reshaping Bitcoin’s Trajectory
The sharp adjustment observed in Bitcoin and the broader crypto market in early 2026 did not originate from an inherent decline in blockchain technology but rather from an abrupt shift in the macro financial environment—a phenomenon dubbed “The Warsh Shock” by the market.
On January 30, 2026, former Federal Reserve Governor Kevin Warsh was nominated as the new Fed Chair, succeeding the outgoing Powell. This personnel change sent ripples of intense volatility through financial markets. Warsh has long been recognized as an “inflation hawk” and a vocal “critic of quantitative easing (QE).” His policy inclinations, revealed during nomination hearings and in past statements—collectively termed the “Warsh Doctrine”—advocate an aggressive “monetary barbell strategy”:
- Short-term interest rates: A potential stance of maintaining neutral or even slightly accommodative rates to bolster real economic growth.
- Balance sheet: A commitment to aggressive quantitative tightening (QT), accelerating the reduction of the Fed’s formidable $6.6 trillion balance sheet to restore central bank policy space and financial discipline.
This anticipated policy combination directly triggered a surge in long-term bond yields. The 10-year US Treasury yield swiftly breached the critical psychological threshold of 4.5% in early February, prompting a broad revaluation across all asset classes. For an asset like Bitcoin, which is acutely sensitive to liquidity, soaring risk-free rates and central bank balance sheet contraction imply a depletion of marginal buying power and a withdrawal of existing capital.
Furthermore, the Federal Reserve, at its January 2026 FOMC meeting, opted to maintain the federal funds rate within the 3.50%-3.75% target range, pausing its earlier rate-cutting trajectory. While market expectations for some degree of rate cuts in 2026 persist, the shadow of “Higher for Longer” once again looms over the market. Analyses from institutions like JPMorgan and BlackRock highlight a recalibration of excessive easing expectations, given inflation has not fully returned to the 2% target and the labor market remains robust.
This macroeconomic backdrop offers crucial insights for Bitcoin’s bottom assessment: the “market bottom” of this cycle is highly likely to coincide with a “liquidity bottom.” Until the Fed ceases quantitative tightening or explicitly signals a shift towards liquidity easing, Bitcoin is unlikely to embark on a new unilateral bull market, instead exhibiting wide-ranging consolidation within its bottom formation zone.
2. Miner Economics: The Hard-Coded Floor of Bitcoin’s Price
Within Bitcoin’s valuation framework, miners are not merely network maintainers; they serve as the “last line of defense” for price stability. Their production costs—predominantly electricity and hardware depreciation—establish Bitcoin’s “physical bottom.” When the coin price dips below the shutdown threshold of mainstream mining machines, high-cost miners are compelled to cease operations. This leads to a decline in network hashrate, which in turn triggers a difficulty adjustment, ultimately lowering the unit cost for remaining miners and initiating a self-regulating price mechanism. This phenomenon, known as “Miner Capitulation,” has historically proven to be one of the most precise indicators of a cycle bottom.
2.1 Hashrate Capitulation: A Necessary Cleansing and Difficulty Adjustment
February 2026 witnessed a historically significant stress test for the Bitcoin network. Data reveals that Bitcoin network mining difficulty plummeted by approximately 11.16% in a single adjustment cycle. This marks the largest single negative adjustment the network has experienced since China’s comprehensive ban on Bitcoin mining in 2021.
This dramatic difficulty reduction was a direct consequence of a substantial retracement in the network’s hashrate. Hashrate declined by roughly 20% from its October 2025 peak (exceeding 1.1 ZettaHashes/s) to approximately 863 ExaHashes/s. This “great retreat” was triggered by a dual pressure:
- Economic Strain from Price Collapse: The coin price halved in a short period (from $126,000 to $60,000), directly breaching the breakeven point for a large number of mid-to-low-end mining machines and operations with high electricity costs.
- Force Majeure Physical Impact: Winter storm “Fern” swept across North America, leading to severe power supply shortages in key mining regions like Texas. Many mining farms were forced to physically disconnect from the grid either in response to grid curtailment programs or due to surging electricity expenses.
While seemingly bearish, this hashrate cleansing paradoxically laid the groundwork for market bottom formation. Historically, deep hashrate retracements and difficulty adjustments often signal the exhaustion of selling pressure. As the most vulnerable miners exit the market, only those with superior cost control and robust financial backing remain, forming the most resilient holder base at the bottom.
2.2 The Miner’s Lifeline: A Detailed Shutdown Price Map ($52,000-$58,000)
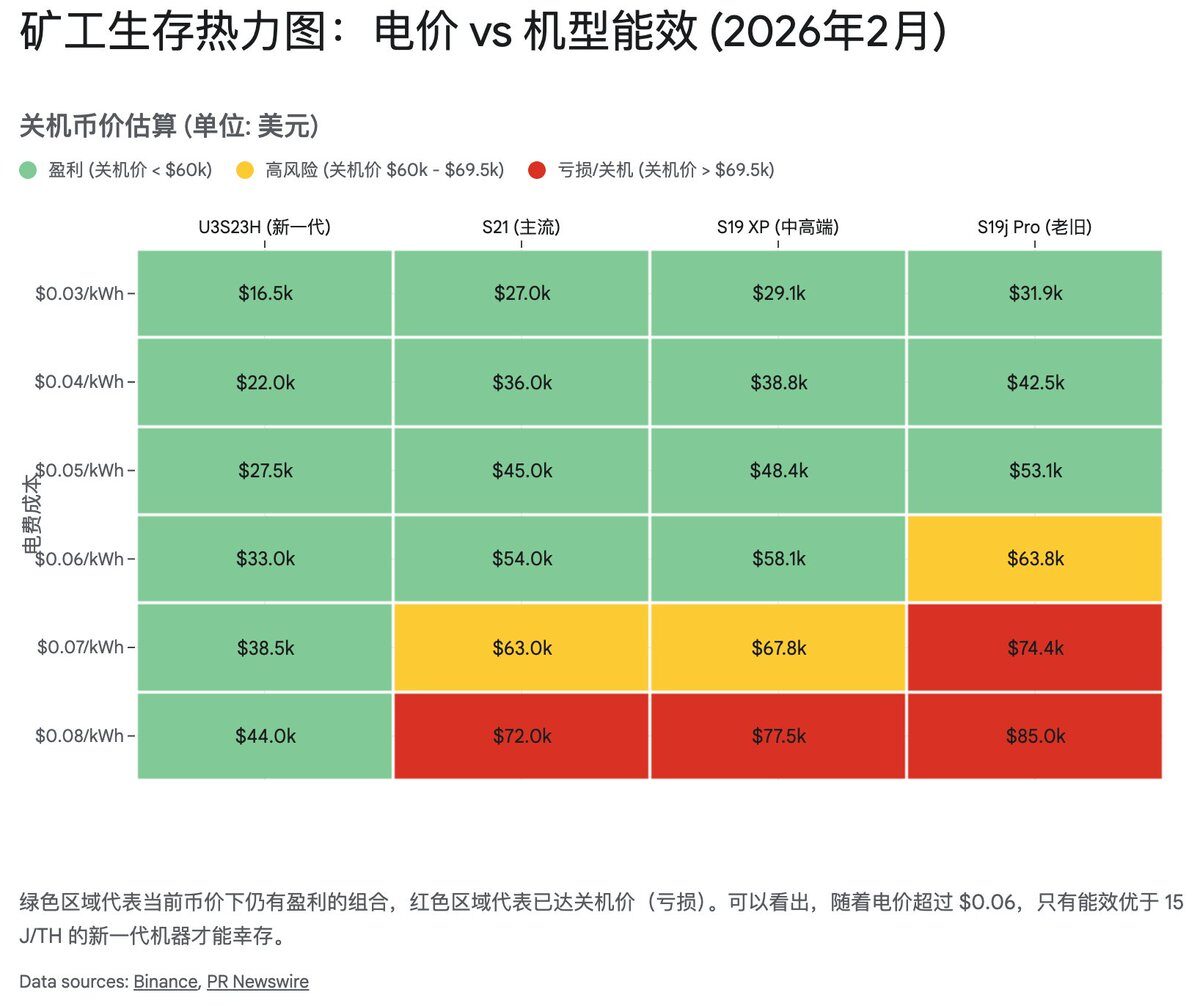
To precisely identify potential bottom price points, a thorough analysis of mainstream mining machine shutdown prices is essential. Based on the current network difficulty (approximately 125.86 T) and typical industrial electricity costs ($0.06/kWh to $0.08/kWh), we can construct a “survival map” for miners.
2.2.1 The Twilight of the S19 Series: $75,000-$85,000
The Antminer S19 series (including S19j Pro, S19 XP, etc.) served as the workhorse of the previous cycle. However, post-2024 halving, its energy efficiency ratio has progressively fallen behind.
- At an electricity cost of $0.08/kWh, the shutdown price for standard S19 and certain Pro models exceeds $85,000.
- Even the more energy-efficient S19 XP sees its shutdown price hovering around $75,000.
- Conclusion: At the current market price of approximately $67,000, the vast majority of miners relying on the S19 series, especially those without competitive electricity rates, are operating at a significant loss. This accounts for the recent decline in hashrate and implies that the selling pressure from this marginal hashrate has largely been exhausted.
2.2.2 The S21 Series Defense Battle: $69,000-$74,000
The Antminer S21 series currently forms the backbone of the network’s hashrate, representing the prevailing mainstream energy efficiency standard.
- Data indicates that the shutdown price range for the S21 series, with a $0.08/kWh cost, is approximately $69,000 to $74,000.
- This data point is critically important. The current Bitcoin price (around $67,000) has already breached this range. This signifies that even miners with newer equipment but slightly higher electricity costs are now confronting shutdown decisions. When mainstream mining machines begin to power down, the market is typically extremely close to its bottom.
2.2.3 Extreme Physical Bottom: $44,000 (S23/U3S23H)
Bitmain’s latest S23 series and U3S23H represent the current apex of human engineering efficiency in mining hardware.
- The shutdown price for these cutting-edge models dips as low as approximately $44,000.
- This level constitutes the “extreme physical hard bottom” of this bear market. Barring a global financial systemic collapse or a catastrophic event at the Bitcoin protocol layer, the price is highly unlikely to breach this threshold. Doing so would imply that virtually all network hashrate would operate at a loss, necessitating a fundamental reconstruction of network security.
Comprehensive Assessment: The $52,000 to $58,000 range is more than just a technical analysis support level; it is the “Maginot Line” of miner economics. A price drop into this zone would compel widespread shutdowns of the S21 series (even for miners with low electricity costs), triggering a deeper wave of hashrate capitulation and subsequent difficulty adjustments. Historically, such profound miner capitulation often coincides with the cycle’s absolute bottom.
3. On-Chain Dynamics: Unmasking Market Psychology
While miner economics define the physical lower bound of the bottom, the distribution and flow of on-chain “chips” reveal the psychological battle at play. On-chain data offers a “God’s eye view” into the behavior of market participants—from short-term speculators to long-term conviction holders. The current on-chain state exhibits classic “capitulation and transfer” characteristics, a necessary stage in bottom formation, though not yet fully complete.
3.1 Short-Term Holders (STH): The Crucible of Capitulation
The price plunge in early February 2026 was, in essence, a “liquidation event” for Short-Term Holders (STHs). Defined as addresses holding coins for less than 155 days, STHs are typically the most conviction-fragile and price-sensitive cohort in the market—often referred to as “retail investors” or “trend followers.”
On-chain data clearly illustrates that as Bitcoin fell below $70,000 and slid towards $60,000, it triggered widespread panic selling among STHs. On February 6 alone, over 100,000 BTC belonging to STHs were transferred to exchanges. This large-scale inflow to exchanges is a quintessential capitulation signal, indicating that a significant volume of coins acquired at higher prices in late 2025 are being sold at a loss.
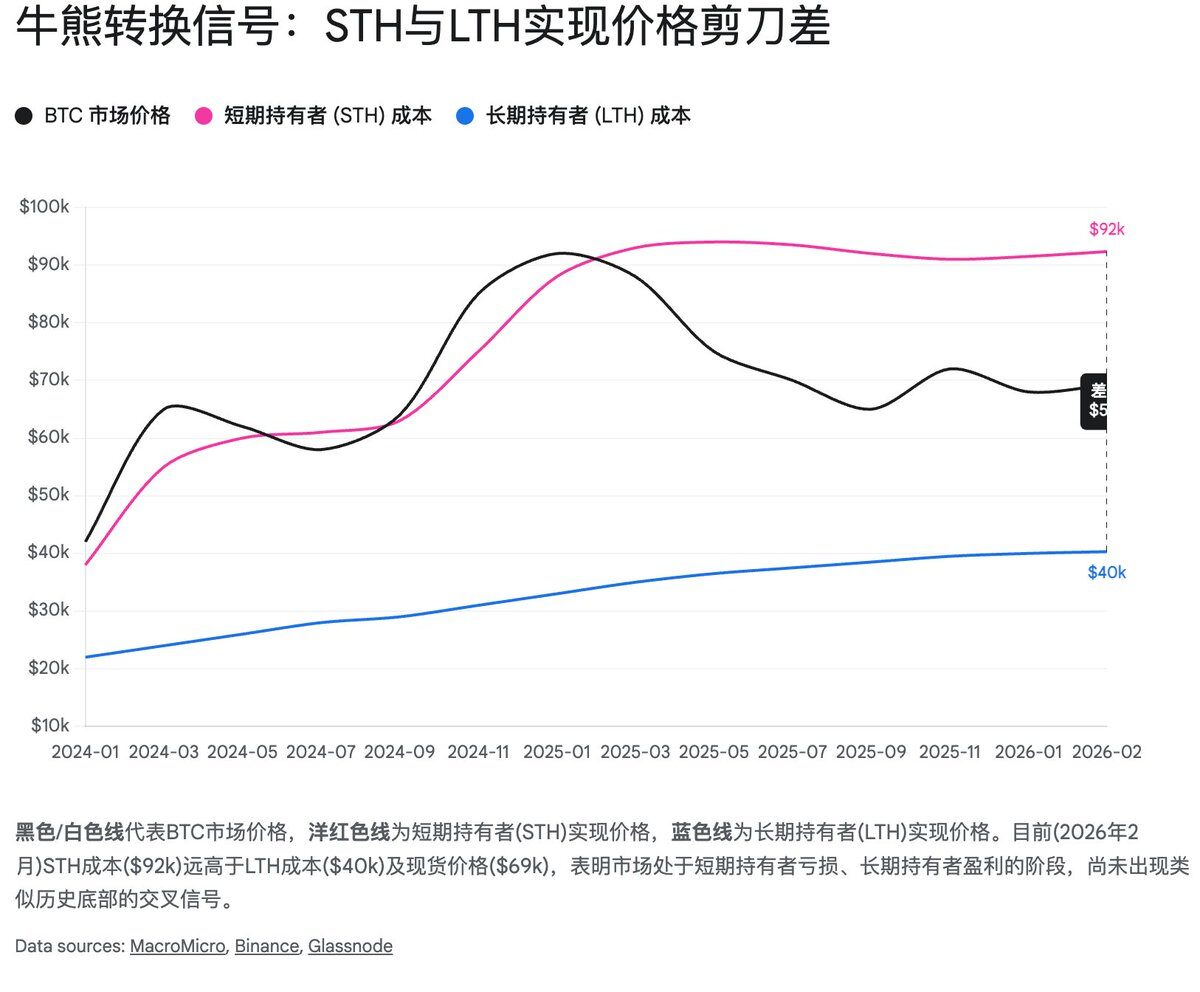
A more critical metric is the STH Realized Price, which represents the average cost basis for short-term holders.
- STH Realized Price: Approximately $92,337.
- Current Market Price: Approximately $67,000.
This is a striking disparity. It implies that short-term holders, as a collective, are currently facing nearly 30% in unrealized losses. Historical precedent suggests that the true bottom of a bear market typically materializes when STHs reach a point of complete despair, and their loss-making holdings are fully flushed out of the market. At such times, the STH Realized Price rapidly declines, often forming a “death cross” with the Long-Term Holder (LTH) Realized Price (signifying that new entrants are acquiring Bitcoin at a lower cost than seasoned holders, indicating extreme undervaluation). While STHs are currently incurring losses, their cost basis has yet to significantly decline and cross with LTHs. This suggests the market may still need a prolonged “grinding” period, characterized by extended sideways movement at low levels, to exhaust high-cost holdings and further depress the average STH cost.
3.2 Long-Term Holders (LTH): The Quiet Accumulation
In stark contrast to the panic among retail investors, Long-Term Holders (LTHs, defined as those holding coins for over 155 days) are beginning to show discernible signs of re-accumulation. Bitfinex’s Alpha report highlights that after a period of sustained distribution (profit-taking) at the bull market peak in the latter half of 2025, LTH holdings bottomed out in December 2025 and have since begun to recover, currently standing at approximately 14.3 million BTC.
- LTH Realized Price: Approximately $40,311.
- Overall Realized Price: Approximately $55,207.
The Overall Realized Price (around $55,200) serves as another critically important defense line. It represents the average price at which all Bitcoins on the network last moved, essentially the entire market’s average cost basis. In deep bear markets, the spot price often briefly dips below the Overall Realized Price, generating extreme despair (as the entire market, on average, is at a loss) before a subsequent V-shaped reversal. The current price (approximately $67,000) is only about 18% away from this crucial defense line, further reinforcing the high risk-reward potential of the $50,000-$58,000 range.
3.3 Institutional and Whale Dynamics: Divergence and Convergence
It is noteworthy that the behavior patterns of institutional funds are undergoing subtle yet significant shifts. While early 2026 saw temporary net outflows from ETFs, exacerbating market selling pressure, a reversal in capital flows occurred as the price approached the $60,000 threshold.
Data from February 10 revealed that US spot Bitcoin ETFs recorded a net inflow of $166 million, with BlackRock’s IBIT notably accumulating assets against the market plunge. This “buy the dip” institutional behavior stands in stark contrast to the panic selling observed among retail investors. This suggests that for institutional capital, which often prioritizes strategic asset allocation, the $60,000 price point has entered their perceived value accumulation zone.
4. Technical Analysis: Decoding Price Structure and Psychological Barriers
Beyond fundamental and on-chain data, a pure analysis of price action and technical indicators also reveals clear and compelling bottoming signals.
4.1 The Super Exchange Zone: A Volumetric Blueprint (72k-52k)
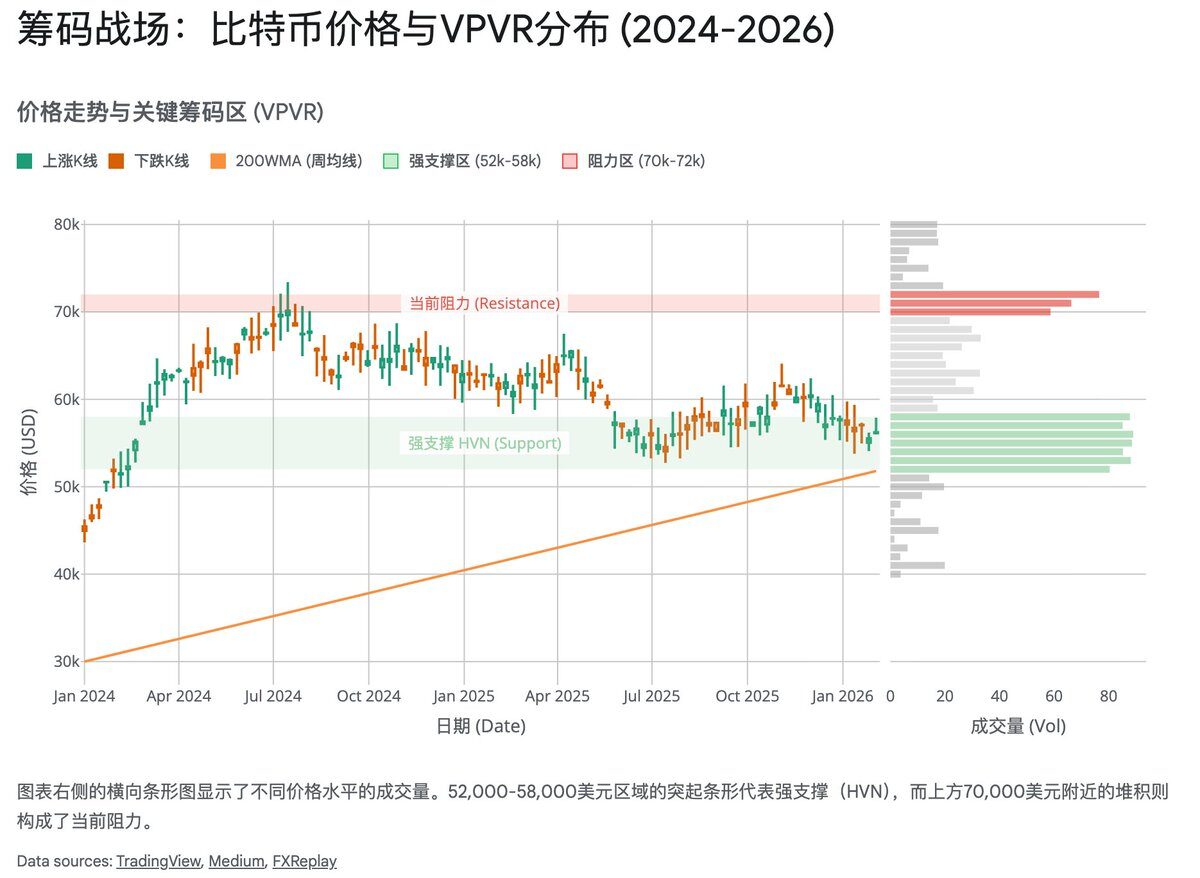
The Volume Profile Visible Range (VPVR) acts as an X-ray machine for identifying significant support and resistance levels. It vividly outlines the accumulation and distribution of “chips” during the 2024-2025 bull market. VPVR data indicates that the broad range of $72,000 to $52,000 represents the “super exchange zone” of the past two years, characterized by an immense volume of historical transactions.
- $70,000-$72,000 (Overhead Resistance): What was once a strong support level has, following its breach, transformed into formidable overhead resistance. A substantial volume of holdings acquired in this range (including some ETF purchases) are now “underwater.” Any rebound towards this zone is likely to encounter selling pressure from those seeking to break even. This explains why recent rallies have repeatedly stalled around $71,000.
- $52,000-$58,000 (Bottom Iron Defense): This zone marks the lower boundary of the super exchange area and is the most densely concentrated region of “High Volume Nodes (HVN)” identified by VPVR. This area not only boasts a significant accumulation of historical trading volume but also overlays with the price structure from the previous bull market (2021). It represents the last bastion for bulls; a decisive breach below this level would plunge the market into a “vacuum zone” of sparse trading volume, potentially leading to a rapid descent towards $40,000.
4.2 The 200-Week Moving Average: The Ultimate Bull-Bear Divide
The 200-Week Moving Average (200WMA) stands as Bitcoin’s most historically reliable and revered long-term bottom indicator. Representing the average holding cost over the past four years, it is widely considered the demarcation line between bull and bear markets.
Currently, the 200-week moving average is trending upwards to approximately $58,000.
- Historical Backtesting: In the bear market bottoms of 2015 and 2018, Bitcoin’s price found firm support and rebounded after merely touching or briefly dipping below the 200-week moving average. While the 2022 bear market saw a temporary breach of this average, the subsequent V-shaped reversal reaffirmed its efficacy as a “value anchor.”
- Current State: As of February 2026, Bitcoin’s price is actively testing this critical moving average. Should the price effectively hold the $58,000 line, it would significantly increase the probability of confirming a cycle bottom. This technical indicator forms a perfect triple confluence with miner shutdown prices (S19 series) and the overall realized price (55k) within the crucial $52k-$58k range.
4.3 Sentiment Extremes: A Contrarian Investor’s Beacon
- Fear & Greed Index: This index has recently plunged into the “extreme fear” range of 5-11. This marks its lowest level since the FTX collapse in 2022. Warren Buffett’s timeless adage, “Be fearful when others are greedy, and greedy when others are fearful,” holds immense statistical relevance here. Historical data consistently shows that when this index remains in single digits for an extended period (several weeks), it often presents the optimal buying opportunity for long-term capital.
- Social Media Sentiment: Discussion volume and overall sentiment across social platforms (Twitter/X, Reddit) reflect a profound “dead silence” or overwhelming pessimism. The proverbial “death cross” is evident not just on price charts but also in the public discourse. This state of low volatility, where retail investors have largely capitulated and market interest wanes, is a necessary psychological prerequisite for a bottom to form.
5. Stablecoins & Liquidity: The Dormant Powerhouse
While analyzing price declines, it is imperative not to overlook the market’s latent purchasing power: stablecoins. The total market capitalization of stablecoins serves as a core indicator of the crypto market’s “dry powder.”
Despite Bitcoin’s significant price retracement, the aggregate market capitalization of stablecoins has not experienced a catastrophic outflow akin to that seen in 2022. Instead, it has remained resilient, hovering near its historical high of $311 billion. This suggests that capital has not fundamentally exited the crypto ecosystem but has rather rotated from volatile Bitcoin and altcoins into the relative safety of on-chain stable assets (USDT/USDC).
- USDT vs. USDC: Notably, USDC’s growth rate has outpaced USDT for the second consecutive year, and its market share in decentralized finance (DeFi) and institutional settlements continues to expand. This trend signals a growing willingness among compliant and institutional funds to engage, as they strategically position themselves on-chain, awaiting greater clarity in the macroeconomic environment.
- Poised for Action: The elevated stablecoin market capitalization functions as a massive “liquidity reservoir.” Once the market trend definitively reverses (e.g., the Federal Reserve halts quantitative tightening or Bitcoin breaks through key resistance levels), this over $300 billion in purchasing power is poised to rapidly convert into fuel, propelling prices upwards. Therefore, closely monitoring changes in stablecoin market capitalization, particularly large issuances of USDC, will be a crucial signal for identifying right-side trading opportunities.
6. Conclusion & Strategic Outlook: Navigating the Storm with Precision
6.1 Where is the Bottom? — The Triple-Layered Verification Model
Synthesizing our comprehensive macro, mining, on-chain, and technical analyses, we can construct a robust, multi-dimensional bottom verification model. This model concretizes the often-ambiguous concept of a “bottom” into three distinct, actionable zones:
- The Physical Bottom ($44,000 – $52,000):
- Definition: This zone represents the shutdown price defense line for the latest generation of high-energy-efficiency mining machines like the S23. It also aligns with the theoretical target for extreme historical drawdowns (60%-70%).
- Probability: Low (<20%). Unless a systemic financial collapse occurs (e.g., aggressive Federal Reserve quantitative tightening leading to a liquidity crisis), the probability of touching this area is minimal. It is considered an “extreme bargain hunting zone.”
- The Value Bottom ($52,000 – $58,000):
- Definition: This is a powerful confluence zone, overlapping the 200-week moving average, the overall realized price, and the mixed shutdown prices of S19/S21 miners. It also corresponds to the lower edge of the super chip-dense area identified by VPVR.
- Probability: Very High (>60%). This area possesses exceptionally strong support and is the most probable zone for major capital accumulation. The market may briefly “wick” into this area, but it is unlikely to sustain prices below it for an extended period.
- The Sentiment Bottom ($60,000 – $65,000):
- Definition: This represents the “outpost battle” currently being tested by the market, serving as a critical psychological threshold. While panic sentiment and initial ETF capital inflows have emerged, considering that Short-Term Holder costs have not yet been fully cleansed, this position may necessitate repeated oscillations and further liquidation. It also carries the risk of a “fake breakdown” designed to trap bearish traders.
6.2 Investment Strategy: The Pyramid Averaging Approach
Given that the bottom is typically a range rather than a single pinpoint, and significant macroeconomic uncertainties (particularly regarding Federal Reserve policy) persist, investors are strongly advised to forgo an “all-in” speculative approach. Instead, adopt a disciplined pyramid averaging strategy for phased accumulation to optimize cost basis and manage risk effectively:
- First Tier (60k-65k): Establish a Base Position (approx. 20%-30% of capital). While this position may appear precarious, it has entered a high risk-reward zone, making it suitable for long-term allocation and mitigating the risk of missing out on a potential reversal.
- Second Tier (52k-58k): Core Accumulation Zone (approx. 40%-50% of capital). Should the price decisively touch the 200-week moving average or the mainstream miner shutdown price range, investors should execute significant additional allocations. This represents the most cost-effective entry point within this cycle.
- Third Tier (44k-52k): Extreme Defensive Zone (reserve 20%-30% liquidity). This liquidity should be reserved to capitalize on potential “black swan” events or extreme price wicks, such as a severe liquidity crunch triggered by macro deterioration. If the market does not descend to this level, these funds can be deployed for chasing after a confirmed right-side trend.
Key Right-Side Signals for Bottom Confirmation:
In addition to strategic left-side orders, investors should vigilantly monitor for the emergence of the following right-side signals:
- Daily-level long lower wick with high volume: Indicating exhaustion of bearish pressure and a forceful counterattack by bulls at crucial support levels.
- STH Realized Price crossing below LTH Realized Price: Or both converging to an extreme proximity, signaling a complete transfer of holdings and the finalization of the bottom structure.
- Significant rebound in stablecoin market capitalization: Particularly large issuances of USDC, signifying a robust recovery in institutional purchasing power.
- Softening of Federal Reserve rhetoric: Any hint of halting quantitative tightening or slowing rate hikes would serve as the definitive catalyst for a liquidity-driven market resurgence.
In this challenging “crypto winter,” patience remains the most invaluable capital. The cycle may be delayed, but it is an immutable force. For steadfast believers, the $52,000-$58,000 range may well be the final, providential gift of the next four-year cycle.
Disclaimer: This report is intended for informational purposes only and does not constitute investment advice. The cryptocurrency market is subject to extreme volatility, and investors should conduct their own due diligence and make independent decisions based on their individual risk tolerance.