
Author: Frank, PANews
The Crypto Enigma: Why Traditional Market Indicators Are Failing in 2026
As early 2026 unfolds, a palpable sense of disillusionment and uncertainty grips the cryptocurrency market.

Bitcoin has retreated approximately 36% from its October 2025 all-time high, with price action oscillating between bullish and bearish sentiments. However, what truly unsettles many crypto investors is not merely the price volatility, but the inexplicable failure of nearly every established indicator system once relied upon to gauge market positioning.
The S2F model’s ambitious $500,000 prediction now deviates from reality by over three-fold. The much-anticipated post-halving explosive rally, a hallmark of the four-year cycle, remains conspicuously absent. The Pi Cycle Top indicator has remained silent throughout the current cycle, its signals un-triggered. MVRV Z-Score’s traditional fixed thresholds are no longer breached, and the upper echelons of the Rainbow Chart seem tantalizingly out of reach. Concurrently, the contrarian signals from the Fear & Greed Index have repeatedly proven inaccurate, and the long-awaited “altcoin season” has yet to materialize.
This collective failure prompts a critical question: are we witnessing a temporary anomaly, or a fundamental, structural shift in the crypto landscape? PANews has undertaken a systematic review and analysis of eight widely discussed indicators that have seemingly lost their predictive power.
The Four-Year Cycle Theory: Halving’s Supply Shock Wanes Amid Maturation
The four-year cycle theory, perhaps the most revered pattern in the crypto market, posits that Bitcoin’s trajectory is dictated by halving events: pre-halving accumulation, an explosive surge 12-18 months post-halving, a subsequent 75%-90% peak-to-trough crash, and finally, a re-accumulation phase. This pattern was demonstrably validated by the halvings of 2012, 2016, and 2020.
Yet, following the April 2024 halving, the market failed to exhibit the characteristic parabolic ascent of prior cycles. Bitcoin’s annualized volatility has notably declined from historical peaks exceeding 100% to roughly 50%, suggesting a more tempered, “slow bull” market. Bear market corrections have also narrowed, with the 2022 peak-to-trough decline of 77% being less severe than the 86% in 2014 and 84% in 2018.
The widespread discussion surrounding the theory’s失效 points to a dominant view: the influx of institutional capital has fundamentally reshaped the market’s microstructure.
Firstly, the launch of Bitcoin spot ETFs in the United States has introduced a continuous demand mechanism, consistently absorbing capital and disrupting the simplistic, halving-driven narrative.
Secondly, on the supply side, the 2024 halving reduced the block reward to 3.125 BTC, effectively cutting daily new supply from approximately 900 BTC to 450 BTC. This annual reduction of about 164,000 coins lowered Bitcoin’s annualized inflation rate from 1.7% to roughly 0.85%. Crucially, this annual supply decrease represents a mere 0.78% of Bitcoin’s total 21 million supply. Relative to Bitcoin’s multi-trillion-dollar market capitalization, the tangible impact of this supply reduction has become all but negligible.
Pi Cycle Top: Diminished Volatility Undermines Crossover Conditions
Developed by Philip Swift, the Pi Cycle Top indicator identifies market peaks by signaling when the 111-day moving average crosses above twice the 350-day moving average. This indicator accurately pinpointed market tops in 2013, 2017, and April 2021.
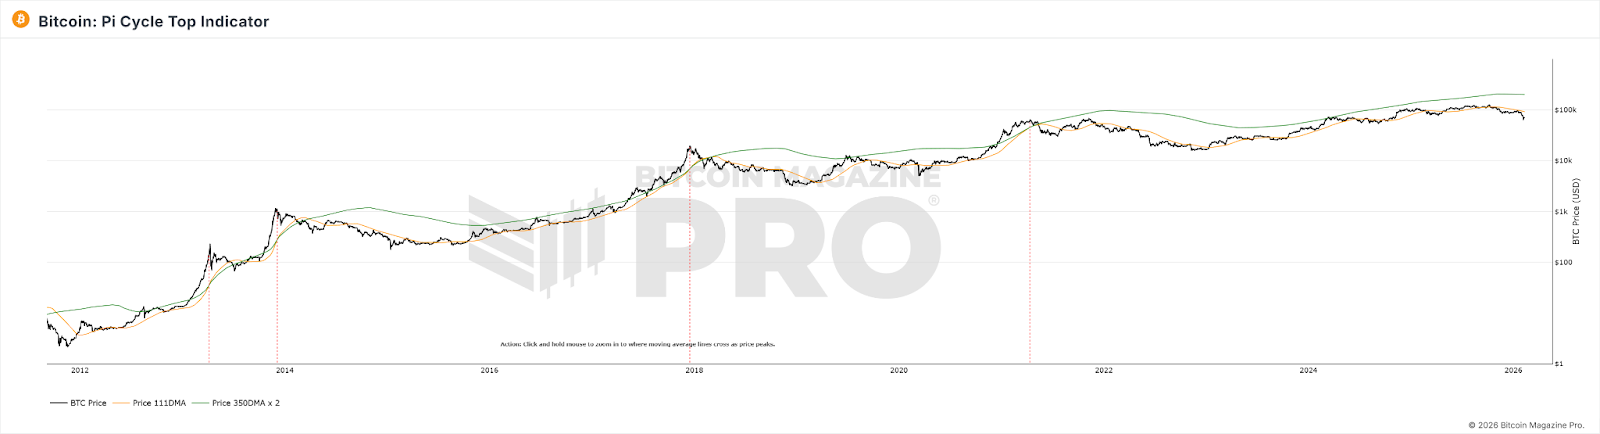
However, throughout the 2025 bull cycle, the two moving averages never executed an effective crossover, leaving the indicator conspicuously “silent.” Despite this, the market’s eventual downward trajectory became unmistakably clear.
The probable cause of this indicator’s failure lies in its inherent reliance on extreme price volatility. Such volatility historically caused short-term moving averages to deviate significantly from long-term ones, enabling the crossover. With Bitcoin’s volatility structurally declining due to ETF adoption and heightened institutional participation, BTC price movements have become smoother, and retail-driven parabolic surges are less frequent. Consequently, the prerequisite conditions for the moving average crossover are no longer easily met. Moreover, as a curve fit derived from Bitcoin’s nascent adoption phase (2013-2021), the indicator’s parameters are likely no longer applicable in a market whose participant structure has undergone a qualitative transformation.
MVRV Z-Score: Shifting Market Dynamics Alter Valuation Fundamentals
The MVRV Z-Score is an on-chain valuation metric that assesses Bitcoin’s market value by comparing its current market capitalization to its realized value (the aggregate value of all BTC based on the price at which each coin last moved on-chain). Traditionally, a Z-Score exceeding 7 signaled an overheated market ripe for selling, while a score below 0 indicated extreme undervaluation and a buying opportunity.
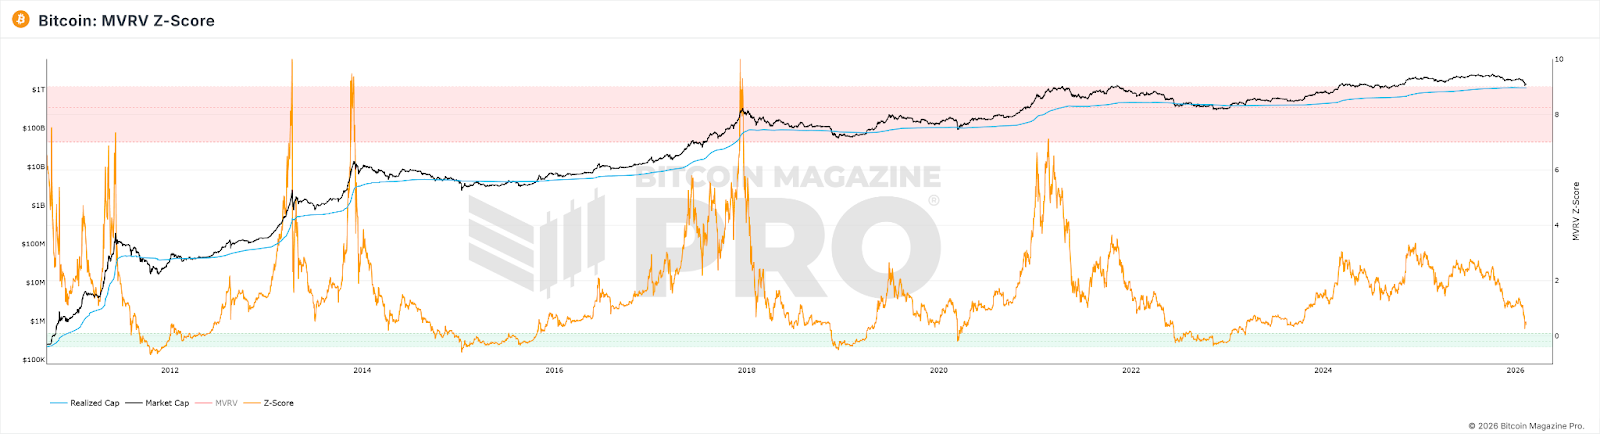
In the 2021 bull market, the Z-Score failed to reach the peaks observed in previous cycles, rendering its traditional fixed threshold (>7) ineffective. By 2025, even as Bitcoin prices reached their zenith, the Z-Score’s highest reading was a mere 2.69.
Several factors likely contribute to this shift:
1. Institutional Holding: Institutions acquiring Bitcoin at higher prices and committing to long-term holding have systematically elevated the Realized Value, bringing it closer to the Market Value and consequently compressing the MVRV’s historical fluctuation range.
2. Active Trading Dynamics: High-frequency trading by short-term participants continuously “refreshes” the Realized Value of actively supplied Bitcoin to near current price levels, further narrowing the gap between Market Value and Realized Value.
3. Market Cap Expansion: As Bitcoin’s market capitalization scales to unprecedented levels, the sheer volume of capital required to generate the extreme Z-Score values seen in earlier, smaller markets has grown exponentially, making such deviations increasingly improbable.
The cumulative effect of these factors is a structural lowering of the Z-Score’s ceiling, rendering the historical “7 = overheated” fixed threshold virtually unattainable.
The Rainbow Chart: Logarithmic Growth Assumptions Under Strain
The Bitcoin Rainbow Chart visually represents Bitcoin’s long-term price trajectory by fitting a logarithmic growth curve, segmenting price ranges into color bands from “deeply undervalued” to “maximum bubble.” Investors historically used these bands to identify opportune buying and selling points. Indeed, in both 2017 and 2021, prices touching the upper color bands reliably coincided with cycle tops.
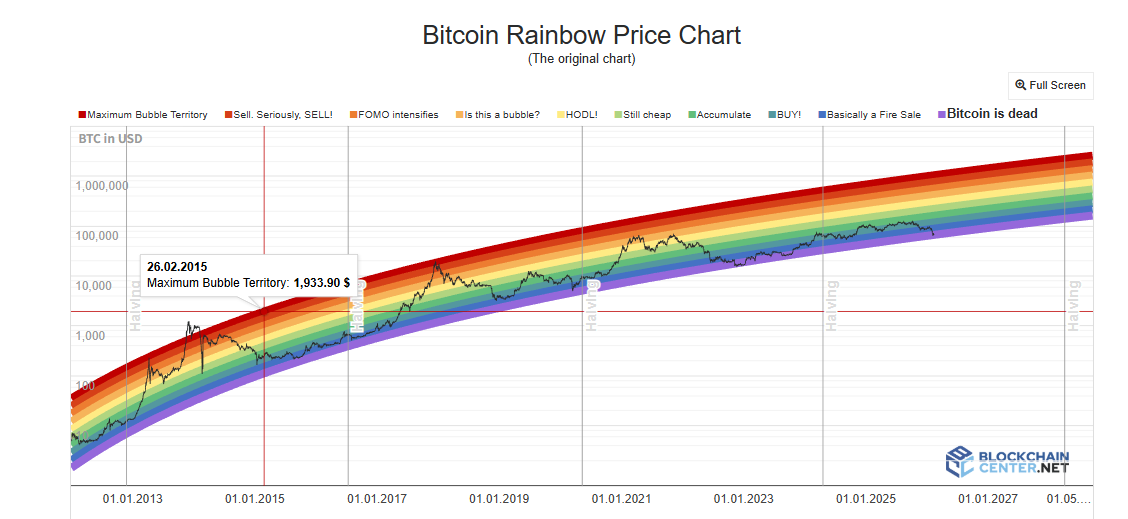
However, throughout the 2024-2025 bull cycle, Bitcoin’s price largely remained within the neutral “HODL!” zone, never approaching the deep red region indicative of an extreme bubble. The chart’s function as a top-prediction tool was virtually non-existent.
For the Rainbow Chart, its model inherently treats price as solely a function of time, disregarding critical variables such as halvings, ETFs, institutional capital flows, or macroeconomic policies. Furthermore, the institutionalization-driven reduction in volatility has systematically narrowed price deviations around the trendline, making it increasingly difficult for prices to reach the fixed-width color bands. Additionally, Bitcoin’s growth trajectory appears to be transitioning from the “steep segment of an adoption S-curve” to the “slow growth phase of a mature asset.” Consequently, the growth rate extrapolated by the logarithmic function systematically overestimates actual growth, causing prices to consistently reside below the chart’s centerline.
Altcoin Season Index & BTC Dominance: The Paradigm of Capital Rotation Has Shifted
The Altcoin Season Index gauges the proportion of the top 100 altcoins that have outperformed Bitcoin over the preceding 90 days; a reading above 75 traditionally signaled an “altcoin season.” Similarly, a drop in BTC Dominance (Bitcoin’s market capitalization as a percentage of the total crypto market cap) below 50% or even 40% was historically interpreted as a clear signal of capital flowing from Bitcoin into altcoins. Both 2017, when BTC Dominance fell from 85% to 33%, and 2021, witnessing a decline from 70% to the 40% range, were characterized by significant altcoin rallies.
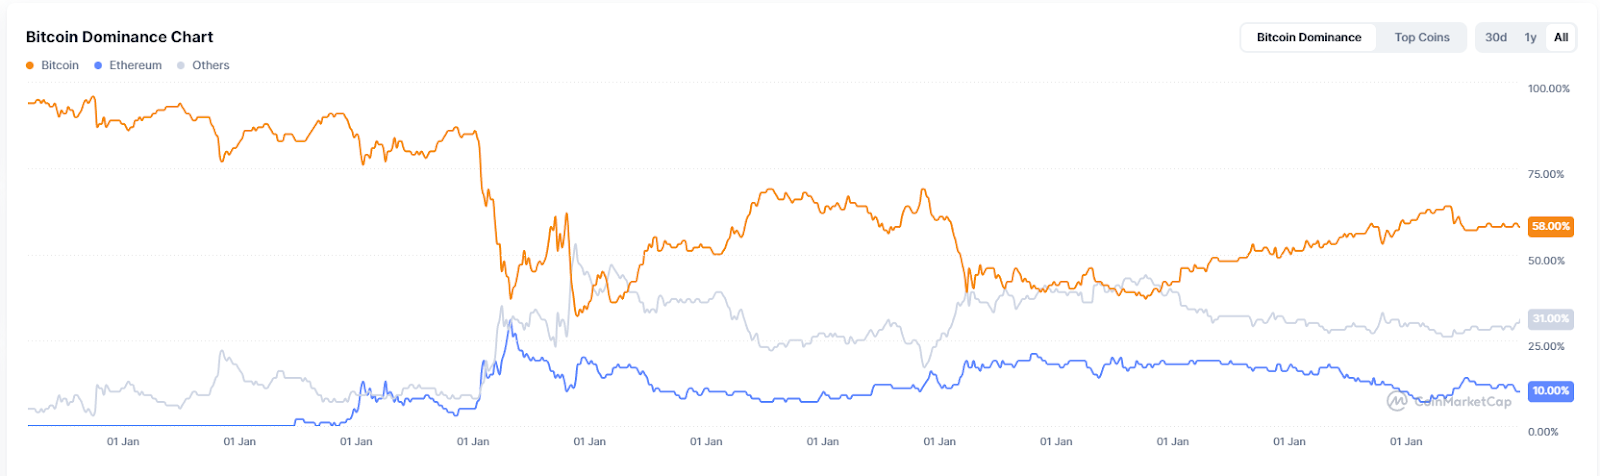
Yet, throughout 2025, the Altcoin Season Index consistently remained below 30, firmly entrenched in “Bitcoin season.” BTC Dominance peaked at 64.34% and never broke below the 50% threshold. By early 2026, the anticipated “altcoin season” manifested more as localized rotations driven by specific narratives, with only niche sectors like AI and Real World Assets (RWA) benefiting, rather than the broad-based rallies seen in previous cycles.
The profound reasons for these indicators’ failure stem from the current market structure, where institutional and ETF capital now play a dominant role. These sophisticated funds exhibit a markedly higher risk appetite for Bitcoin compared to altcoins. Furthermore, substantial capital has been siphoned away by the market frenzy surrounding Artificial Intelligence (AI) and precious metals, diminishing overall capital inflows into the crypto market. The incremental capital attracted by Bitcoin ETFs flows directly into BTC and is structurally unlikely to “rotate” into altcoins, as ETF holders are purchasing financial products, not entry tickets to the broader crypto ecosystem. Additionally, the exhaustion of compelling narratives within the altcoin ecosystem and weakened liquidity support for new projects are significant contributing factors to the delayed “altcoin season.”
Fear & Greed Index: Retail Sentiment No Longer Dictates Price Action
The Crypto Fear & Greed Index aggregates multiple factors, including volatility, market momentum, social media sentiment, and Google Trends, to generate a score between 0 and 100. Its classic application is contrarian: buying during periods of extreme fear and selling during extreme greed.
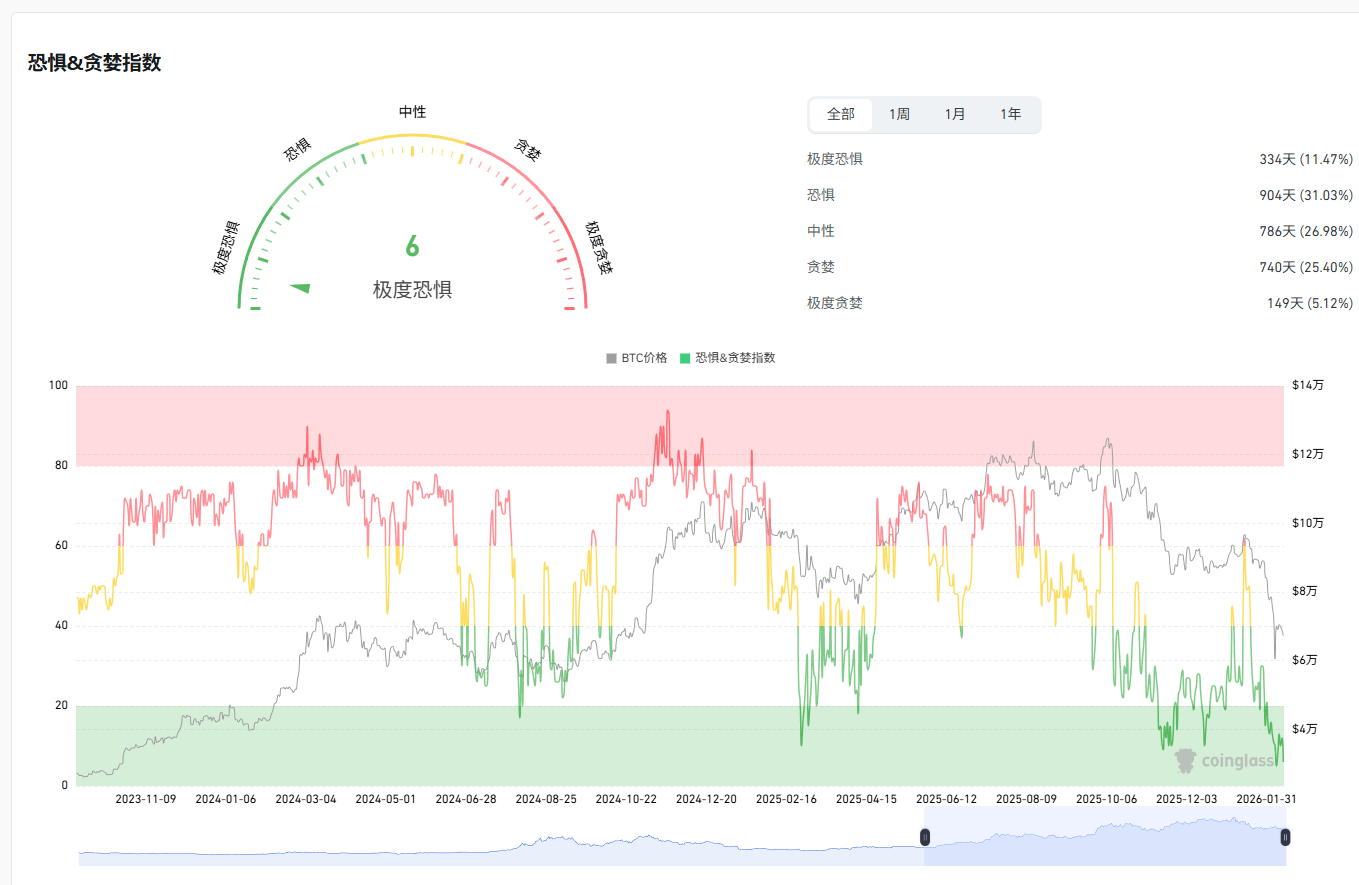
In April 2025, the index plunged below 10, a level even lower than during the FTX collapse, yet Bitcoin failed to deliver the anticipated significant rebound. The annual 30-day average for the year was a mere 32, with 27 days spent in the “fear” or “extreme fear” zones. As a top signal, the indicator proved equally unreliable; at the market peak in October 2025, the index only reached approximately 70.
The core reason for the Crypto Fear & Greed Index’s失效 lies in the disruption of the sentiment-to-price transmission mechanism by institutional capital. When retail investors are gripped by fear, institutions may be strategically accumulating on dips; conversely, when retail investors exhibit greed, institutions might be hedging their positions with derivatives. This dynamic fundamentally shifts the balance of power, ensuring that retail sentiment is no longer the decisive force driving price movements.
NVT Ratio: On-Chain Volume Fails to Reflect True Economic Activity
The NVT Ratio, often dubbed the “crypto P/E ratio,” is calculated by dividing the network’s market capitalization by its daily on-chain transaction volume. Traditionally, a high NVT suggested overvaluation, while a low NVT indicated potential undervaluation.
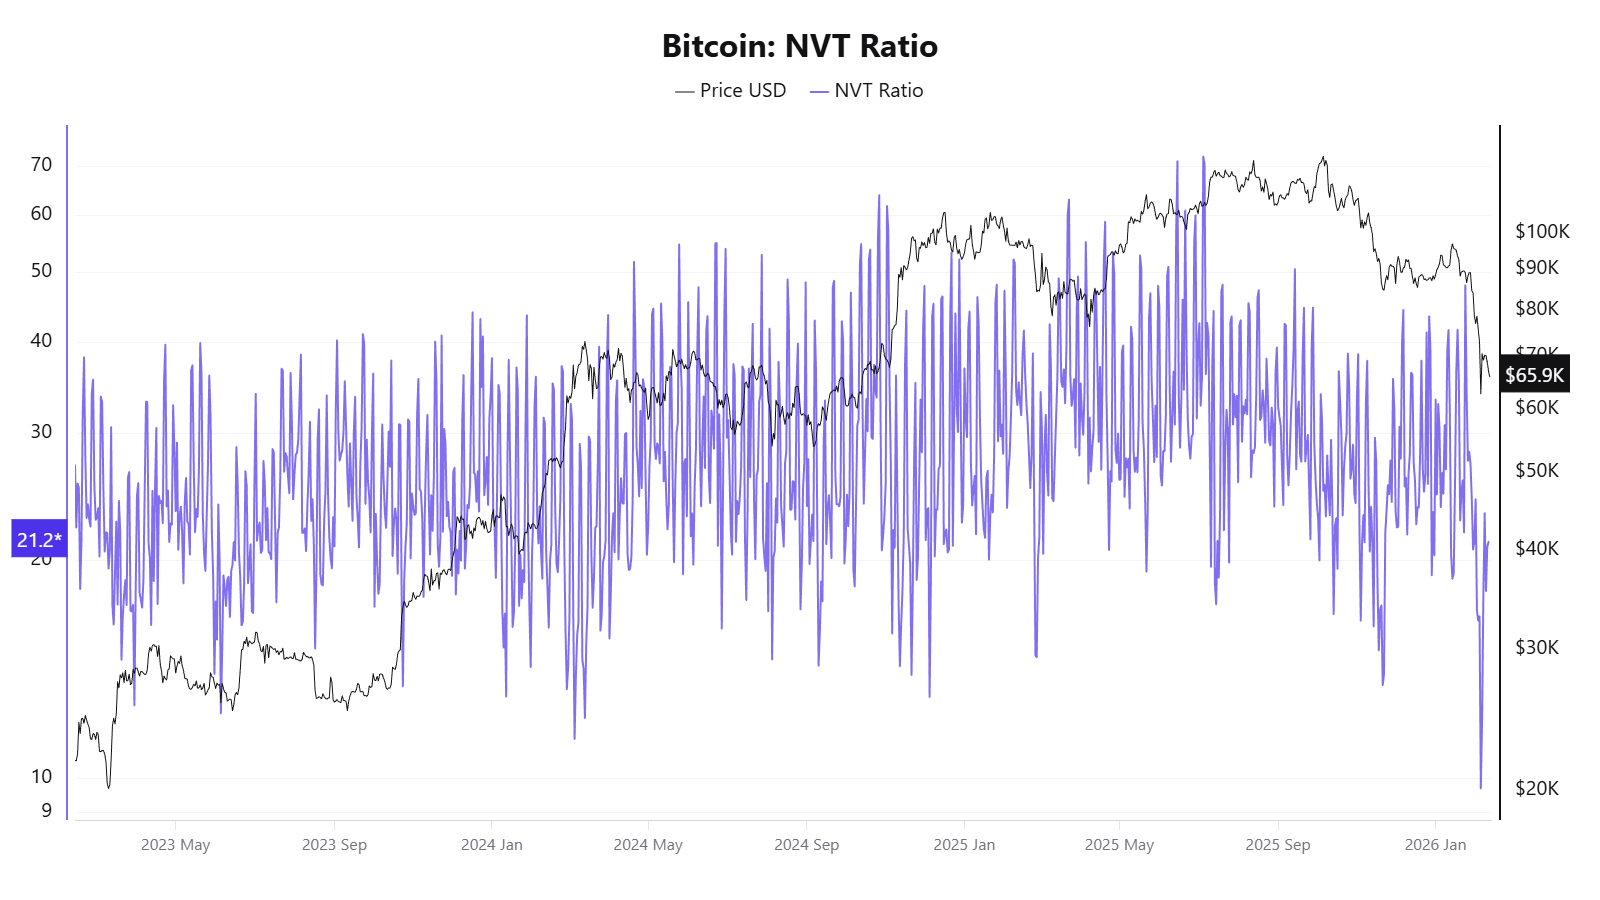
In 2025, this indicator presented contradictory signals. In April, when prices had not yet experienced a substantial surge, the NVT Golden Cross soared to 58. Yet, in October, when Bitcoin’s price reached approximately $120,000, the indicator paradoxically suggested that prices were undervalued.
The fundamental flaw leading to NVT’s failure lies in its denominator: on-chain transaction volume. This metric can no longer accurately represent the true economic activity occurring on the Bitcoin network.
S2F Model: The Peril of a Supply-Only Perspective
The Stock-to-Flow (S2F) model, introduced by anonymous analyst PlanB in 2019, adapts precious metal valuation principles. It quantifies Bitcoin’s scarcity by the ratio of its existing supply (stock) to its annual new supply (flow) and projects a price curve through logarithmic regression. The model’s core assumption is that each halving, by doubling the S2F ratio, should trigger an exponential increase in price.
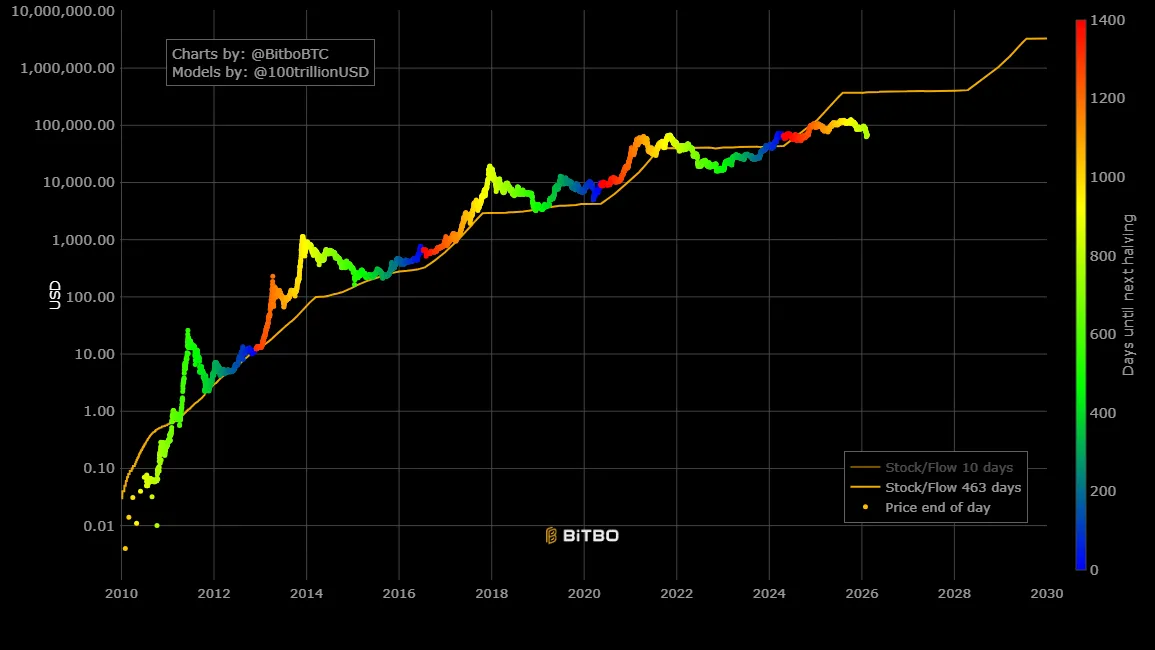
The model’s predictive failure became starkly evident in December 2021, when it forecasted BTC to reach approximately $100,000; the actual price was around $47,000, a deviation exceeding 50%. By 2025, the model’s target of $500,000 contrasted sharply with the actual price of about $120,000, widening the discrepancy to over three-fold.
The fundamental reason for S2F’s failure is its nature as a purely supply-side model, which entirely disregards demand-side variables. Moreover, as Bitcoin’s market capitalization ascends into the trillions, sustained exponential growth becomes increasingly challenging to achieve physically. The reality of diminishing marginal returns is an unavoidable factor that the model fails to account for.
The Deeper Truth: A Shift in Market Assumptions, Not Isolated Failures
A comprehensive examination of these indicators’ collective failure reveals that their malfunction is not a series of isolated incidents. Instead, it points to a cohesive set of structural transformations within the market:
Institutionalization Reshapes Market Microstructure: The advent of Bitcoin ETFs, corporate treasury allocations, CME derivatives, and the entry of pension funds have fundamentally altered both capital flows and the price discovery mechanism. Institutions tend to buy dips and maintain long-term holdings, thereby smoothing out the extreme volatility previously driven by retail sentiment. This shift renders indicators reliant on extreme volatility or sentiment signals largely inoperable in their original form. Furthermore, the significant siphoning of capital by the burgeoning AI sector and traditional precious metals markets has reduced overall liquidity within the crypto ecosystem.
Structural Decline in Volatility: A systemic reduction in volatility is the direct technical cause for the failure of numerous indicators. The Pi Cycle Top and Rainbow Chart necessitate extreme price surges to trigger their signals. MVRV requires a substantial divergence between market capitalization and cost basis, while funding rates depend on extreme long-short imbalances. As volatility has decreased from 100% to approximately 50%, these critical conditions are increasingly difficult to satisfy.
Bitcoin’s Evolving Asset Class: Bitcoin’s identity is transitioning from a digital commodity to a macro financial asset. Consequently, its price drivers are shifting from purely on-chain variables (like halvings and network activity) to broader macroeconomic factors such as Federal Reserve policy, global liquidity, and geopolitical events. Indicators primarily focused on analyzing on-chain data are increasingly confronting a market dominated by off-chain influences.
Diminished Representativeness of On-Chain Data: The proliferation of Layer 2 transactions, internal exchange settlements, and ETF custody models are gradually eroding the foundational data integrity of on-chain indicators. This trend makes it progressively harder for metrics like NVT and MVRV, which rely heavily on on-chain transaction data, to capture the complete market picture.
Furthermore, most classic indicators are essentially curve fits derived from a limited sample size of 3-4 halving cycles. Such models are inherently susceptible to failure when the underlying market environment undergoes qualitative changes.
For the average investor, the collective failure of these indicators conveys a more fundamental message: understanding the underlying assumptions and boundary conditions of each indicator is arguably more crucial than the pursuit of a universal predictive tool. Over-reliance on any single metric can lead to significant misjudgments. In a phase where the fundamental rules of the market are being rewritten, maintaining cognitive flexibility and adaptability may prove more pragmatic than tirelessly searching for the next “magic indicator.”
(The above content is an excerpt and reproduction authorized by partner PANews, original link)
Disclaimer: This article is for market information purposes only. All content and views are for reference only and do not constitute investment advice. They do not represent the views and positions of BlockBeats. Investors should make their own decisions and trades. The author and BlockBeats will not bear any responsibility for direct or indirect losses incurred by investors’ transactions.