
Unveiling the True State of Stablecoins: A Deep Dive Beyond Supply Numbers
Authored by: Dune
Compiled by: Felix, PANews
While stablecoin supply figures are frequently cited across financial reports, earnings calls, and policy hearings, a deeper understanding of this critical digital asset class has long been elusive. Beyond the headline number of “over $300 billion in circulation,” what truly underpins the stablecoin market?
Who are the actual holders? How concentrated is ownership? What is their true circulation velocity? Which blockchains are driving their usage, and what are their practical applications—is it primarily for DeFi liquidity, cross-border payments, or simply as idle capital?
The urgency for these insights is growing as institutional adoption accelerates. Recent developments, such as Meta’s plans to integrate third-party stablecoin payments, Bridge’s OCC approval for a national trust bank, Payoneer enabling stablecoin functionality for millions of merchants, and Anchorage Digital launching compliant stablecoin services for non-US banks, signal a significant shift. Institutions and regulators are entering the fray, demanding answers far more profound than mere supply statistics.
In response to this demand, Dune, in collaboration with Steakhouse Financial, has launched a groundbreaking stablecoin dataset. This comprehensive resource delves into holder composition, fund flows, categorized on-chain behaviors, and circulation velocity, providing institutional-grade analysis for research, compliance, and strategic decision-making. Through interpreting this powerful dataset, Dune has published an article revealing the compelling realities of the stablecoin market. Here’s what the data uncovers:
Stablecoin Supply: A Comprehensive Overview
As of January 2026, the aggregate fully diluted supply of the 15 largest stablecoins across EVM-compatible chains, Solana, and Tron reached an impressive $304 billion, marking a substantial 49% year-over-year increase. Tether’s USDT, with $197 billion, and Circle’s USDC, at $73 billion, collectively command a dominant 89% of the market share.
Examining the distribution by blockchain reveals Ethereum leading with $176 billion (58%), followed by Tron at $84 billion (28%), Solana with $15 billion (5%), and BNB Chain at $13 billion (4%). Despite the near-doubling of total supply, the proportional distribution across these major chains has remained remarkably consistent over the past year.
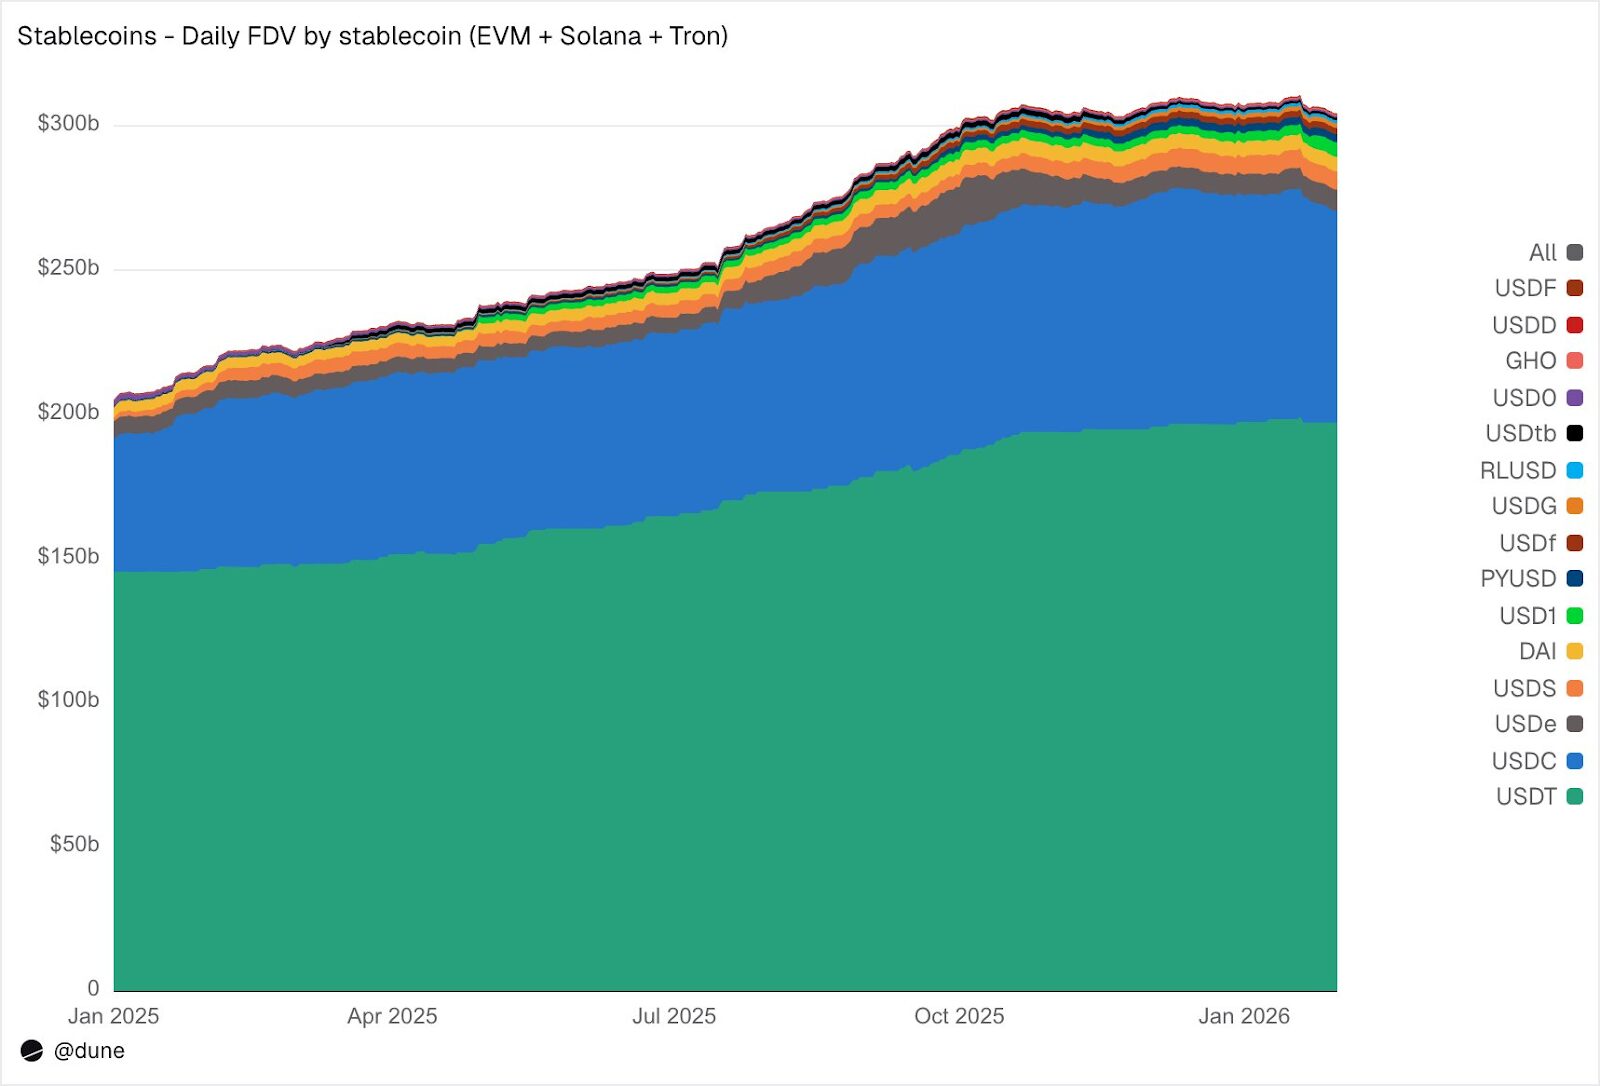
Beyond the established giants, 2025 emerged as the “year of the challengers.” USDS (Sky Ecosystem) saw its market capitalization surge by 376% to $6.3 billion. PayPal’s PYUSD experienced a remarkable 753% growth, reaching $2.8 billion. Ripple’s RLUSD skyrocketed from $58 million to $1.1 billion—an astonishing 1,803% increase. USDG’s market cap expanded 52-fold, while USD1 soared from zero to $5.1 billion.
However, not all challengers witnessed upward trajectories. USD0 declined by 66%, and Ethena’s USDe, after nearly tripling to a peak in October, concluded the year with a 23% gain. Nevertheless, the competitive landscape beneath USDT and USDC has undeniably expanded significantly.
Who Holds Stablecoins? Unpacking On-Chain Ownership
Traditional stablecoin datasets often provide only aggregate supply figures. Dune’s innovative dataset, however, offers a granular view by tracking wallet-level balances and employing sophisticated address labeling. This capability allows us to answer the crucial question: who truly holds these stablecoins?
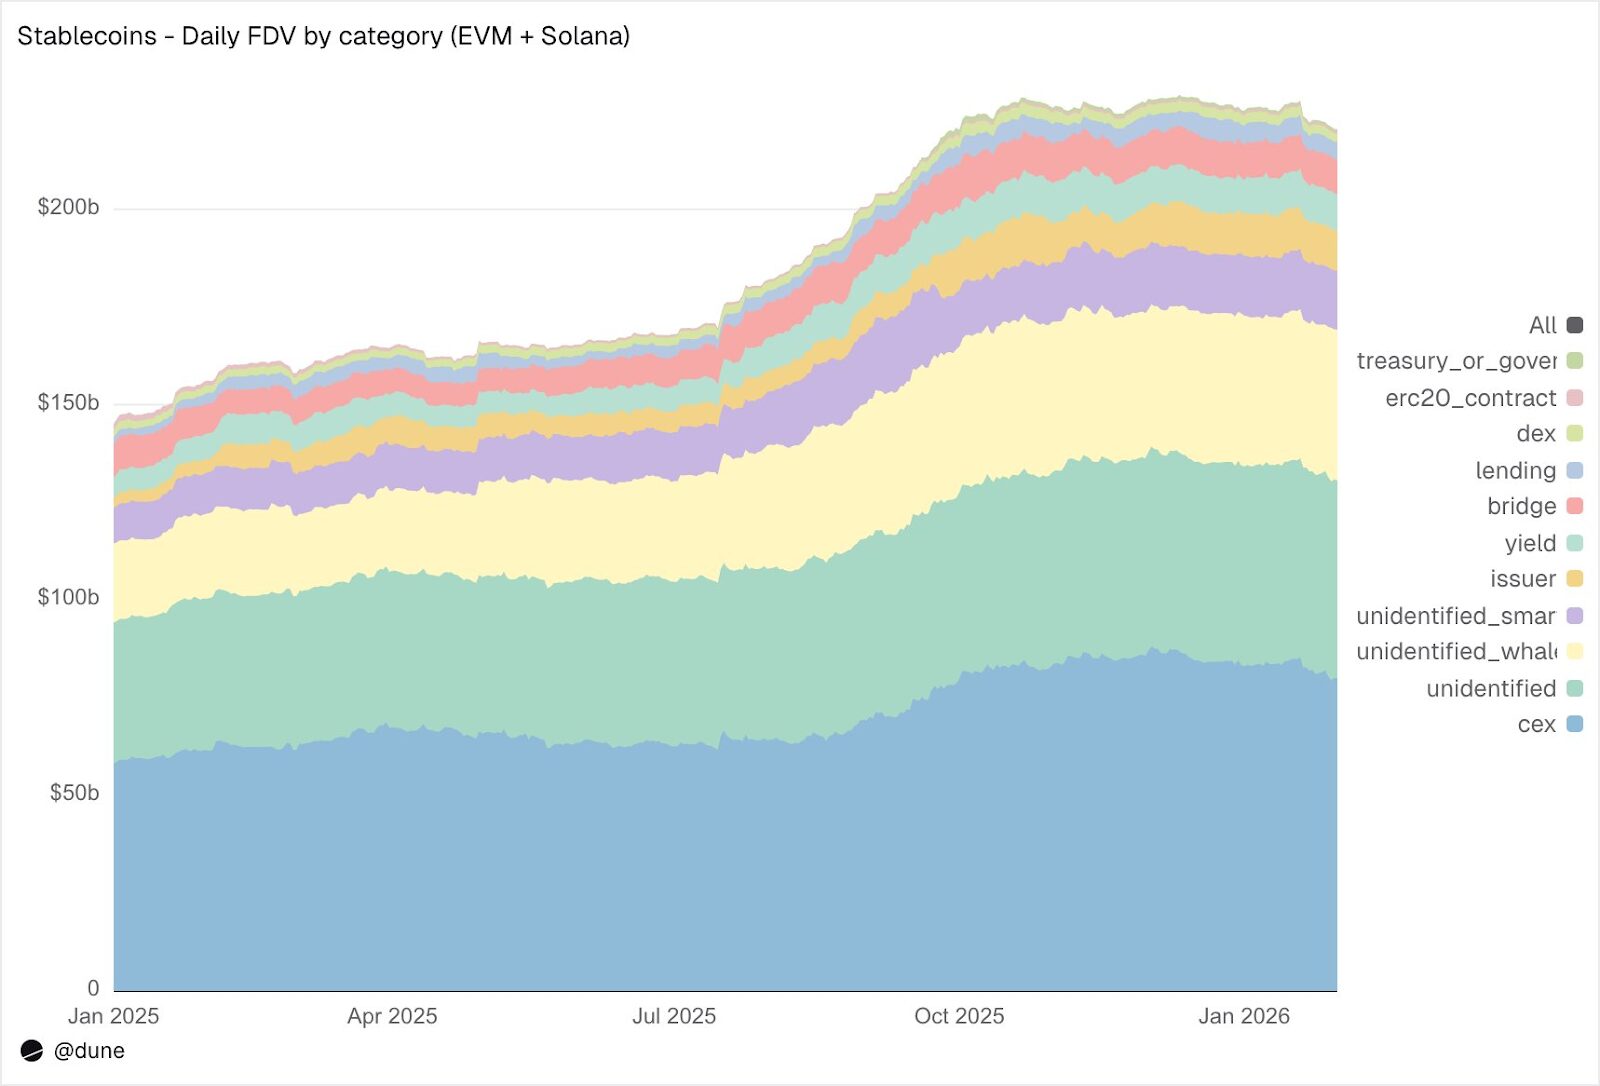
Across EVM-compatible chains and Solana, Centralized Exchanges (CEXs) represent the largest identified holder category, with holdings reaching $80 billion (up from $58 billion last year). This underscores stablecoins’ foundational role as trading and settlement infrastructure for exchanges. “Whale” wallets collectively hold $39 billion. Yield protocol holdings nearly doubled to $9.3 billion, reflecting the escalating interest and growth in on-chain yield generation strategies. Furthermore, issuer addresses (treasuries and mint/burn contracts) saw a 4.6-fold increase from $2.2 billion to $10.2 billion, directly indicating the scale of new stablecoin supply entering the market.
A testament to the dataset’s quality, only 23% of the total stablecoin supply resides in completely unidentified addresses. This exceptionally high identification rate for on-chain data is paramount for understanding and mitigating potential stablecoin risk exposures.
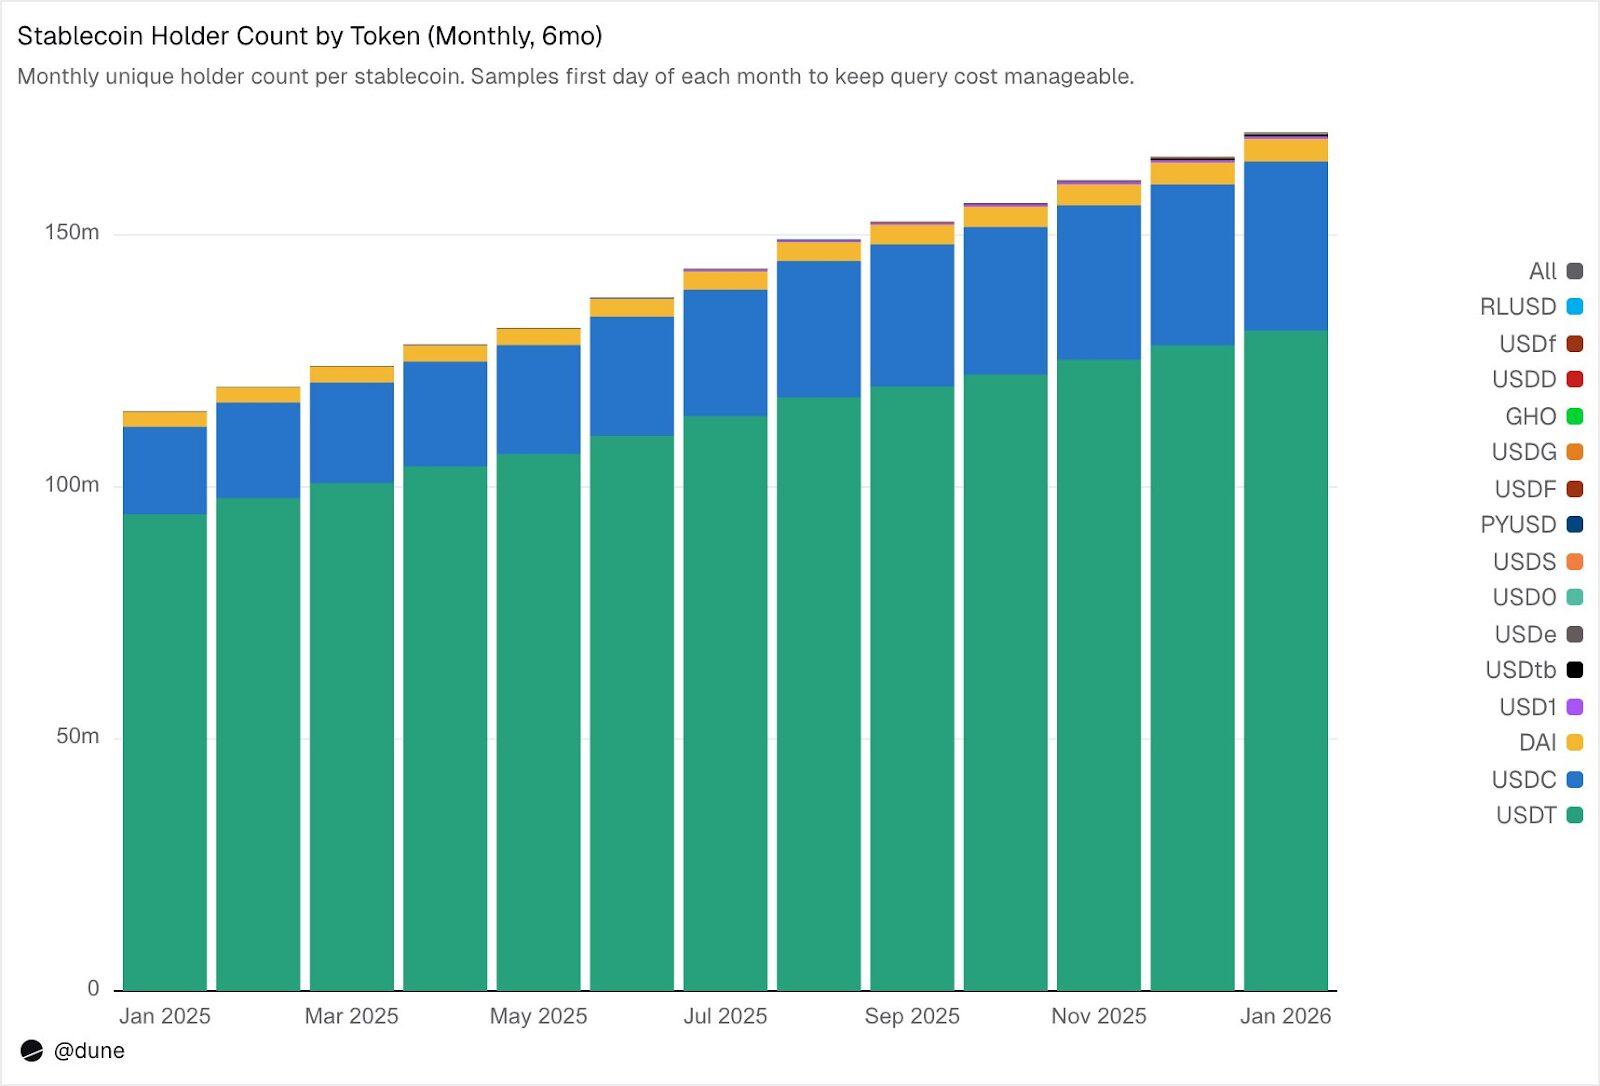
172 Million Holders, Yet High Concentration Persists
As of February 2026, a staggering 172 million unique addresses held at least one of the 15 analyzed stablecoins. USDT alone accounts for 136 million holders, USDC for 36 million, and DAI for 4.7 million. These three major stablecoins exhibit broad distribution, with their top 10 wallets holding only 23-26% of the total supply. Their Herfindahl-Hirschman Index (HHI)—a standard economic measure of concentration where 0 signifies perfect dispersion and 1.0 indicates a single holder—remains below 0.03, signifying a healthy level of decentralization in ownership.
However, the landscape for other stablecoins presents a stark contrast. The top 10 wallets for these assets often control 60-99% of the supply. For instance, USDS, despite a circulation of $6.9 billion, sees 90% of its supply concentrated in just 10 wallets (HHI 0.48). USDF shows an even higher concentration, with 99% held by its top 10 wallets (HHI 0.54). USD0 stands out as the most extreme case, with 99% concentration in its top 10 wallets (HHI 0.84), implying that even within this small group, one or two wallets dominate the supply.
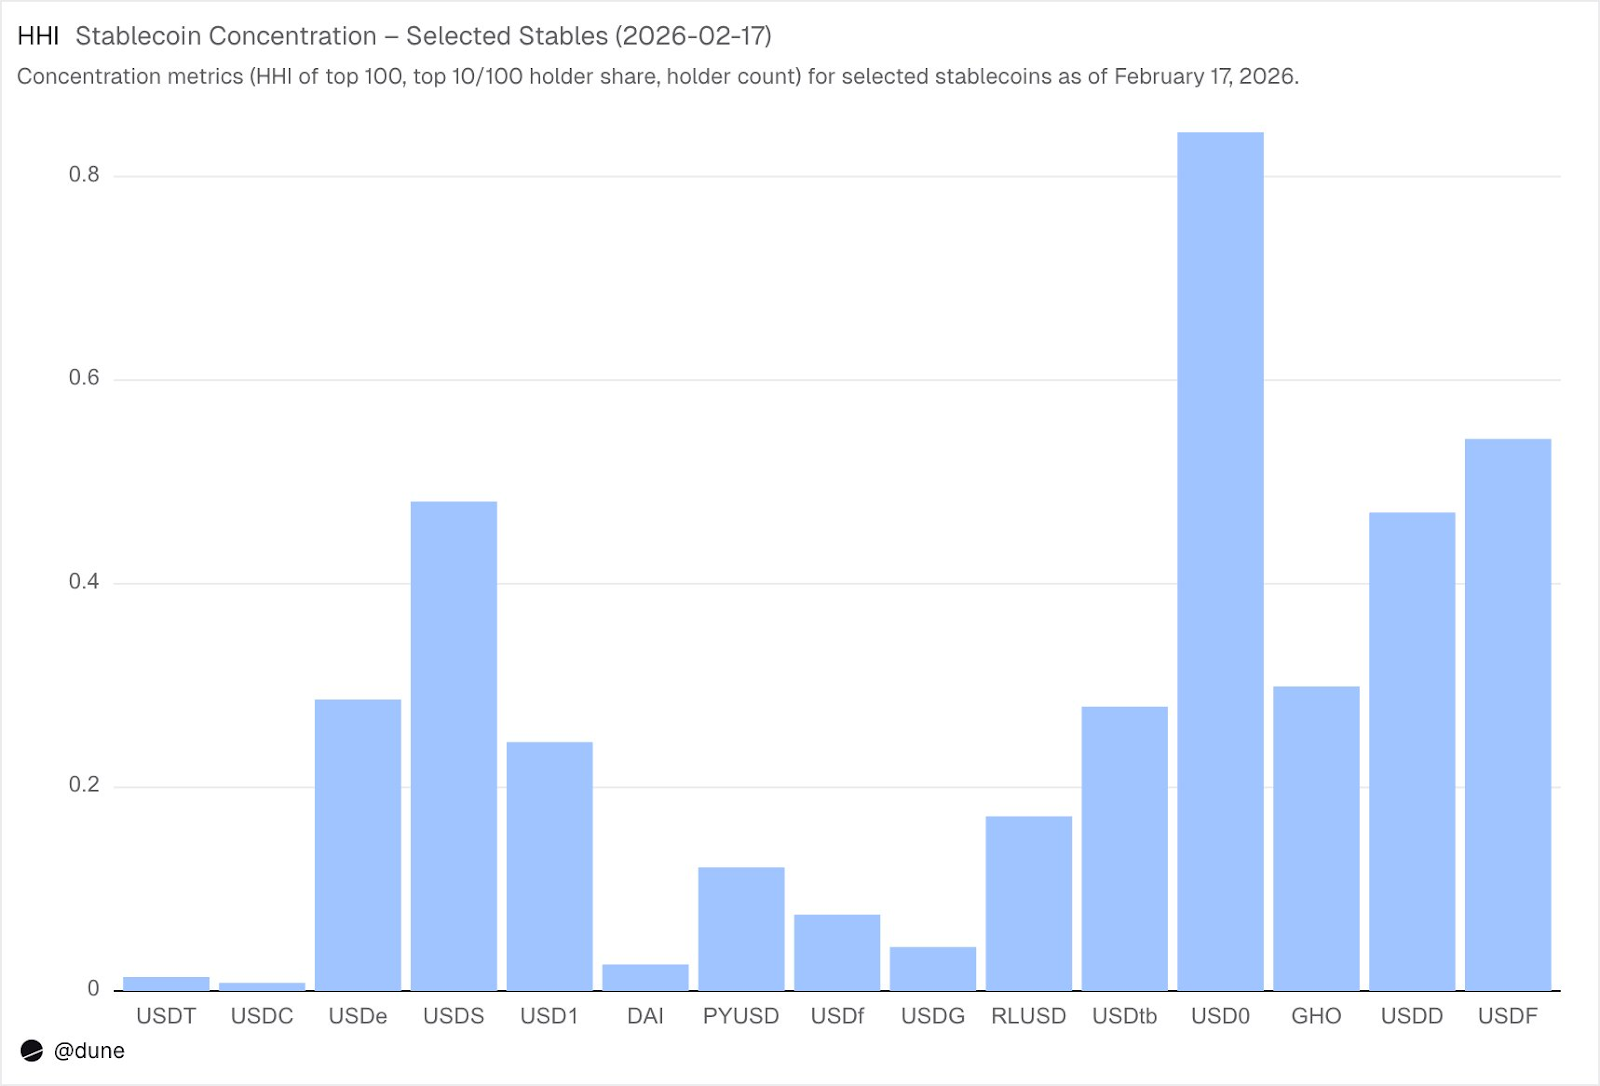
While such concentration doesn’t inherently imply issues—some stablecoins are newer, and others are intentionally designed for specific institutional use cases—it necessitates a different analytical approach compared to USDT or USDC. High concentration can influence de-peg risk, liquidity depth, and whether the reported supply truly reflects organic demand or the holdings of a few large players. This nuanced analysis is only achievable by examining all holder balances, rather than relying solely on aggregated mint/burn event data.
Stablecoin Transfer Volume Soars to $10.3 Trillion in January
January witnessed an extraordinary surge in stablecoin transfer volume across EVM, Solana, and Tron, reaching an astounding $10.3 trillion—more than double the volume recorded in January 2025. The distribution of this on-chain transaction volume is particularly striking and deviates significantly from the stablecoins’ supply share across chains.
Surprisingly, Base, with a relatively modest supply of $4.4 billion, spearheaded the transfer volume with $5.9 trillion. Ethereum followed with $2.4 trillion, Tron with $682 billion, Solana with $544 billion, and BNB Chain with $406 billion.
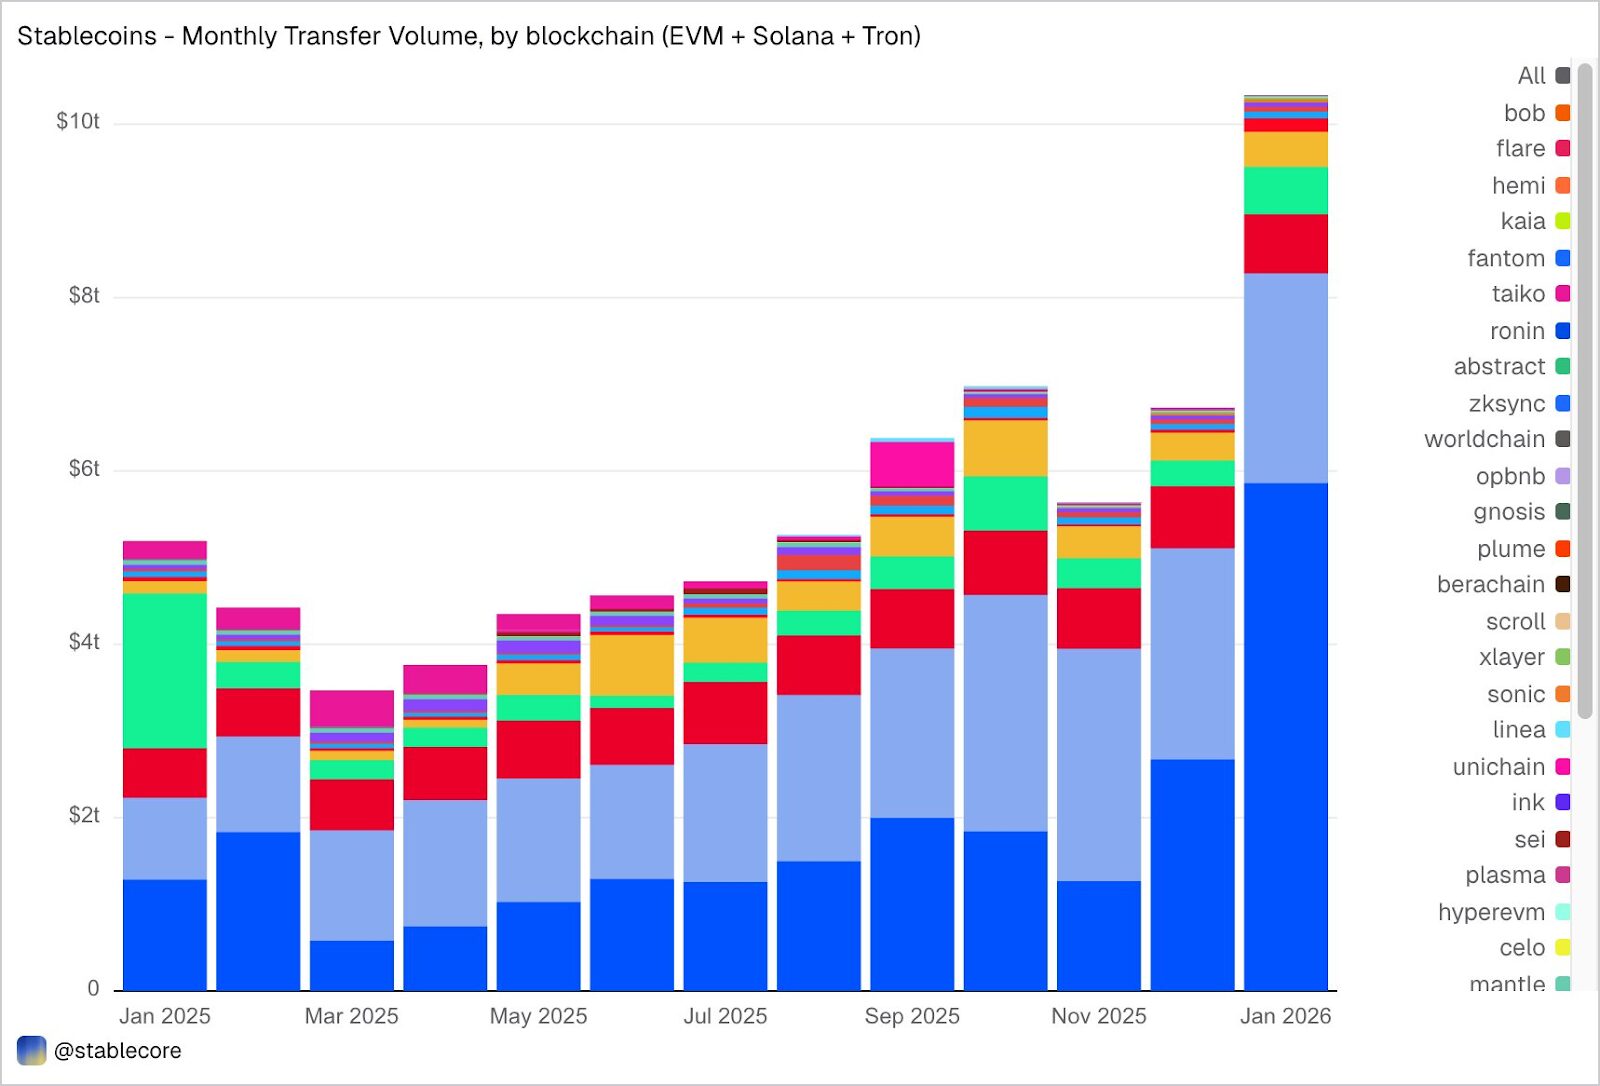
When categorized by token, USDC emerged as the dominant force, accounting for $8.3 trillion in transfers. This is nearly five times the volume of USDT ($1.7 trillion), despite USDC’s supply being 2.7 times smaller than USDT’s. This disparity clearly indicates that USDC exhibits significantly higher transfer velocity and frequency compared to USDT. Other notable volumes include DAI at $138 billion, USDS at $92 billion, and USD1 at $43 billion.
It is crucial to note that this data is presented objectively and neutrally. The dataset does not pre-filter transfers based on a predefined interpretation of “real” economic activity. Therefore, the total volume may encompass traffic related to arbitrage, bot activity, internal routing, or other automated behaviors. Our objective is to provide a comprehensive, unbiased view of on-chain activity, empowering users to apply their own filtering criteria—for example, by removing bot-driven volume, isolating organic usage, or defining transaction activity metrics that align with their specific analytical needs.
What Are Stablecoins Actually Doing? Deconstructing On-Chain Activity
Beyond simply quantifying “volume,” Dune’s dataset meticulously categorizes stablecoin transfers into specific on-chain activities, offering unparalleled insight into their functional roles within the digital economy:
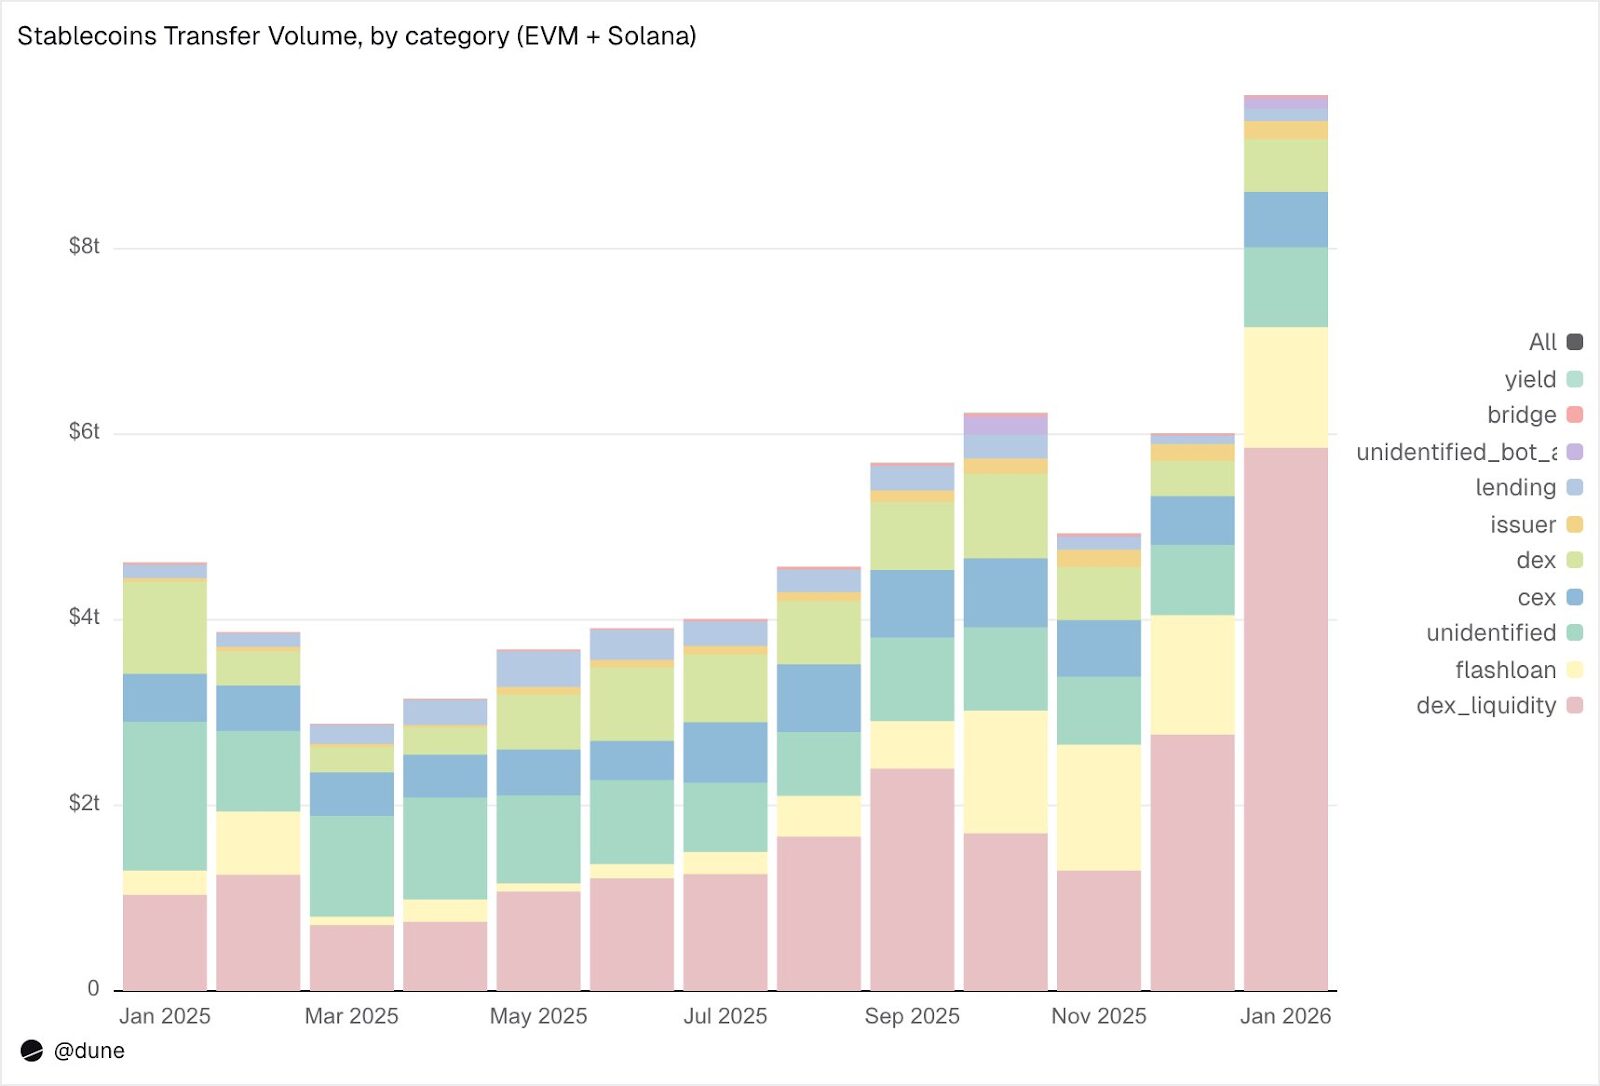
A detailed breakdown for January reveals:
- Market Infrastructure (DEX Trading & Liquidity):
- DEX Liquidity Provision & Withdrawal: $5.9 trillion. This represents the single largest use case, highlighting stablecoins’ fundamental role as base assets for on-chain market making.
- DEX Swaps: $376 billion. Direct trading activities executed via automated market makers.
Combined, these categories underscore stablecoins’ primary function as trading collateral and liquidity infrastructure. It’s noteworthy that a significant portion of this volume is concentrated in incentive-driven activities, such as yield farming and active capital optimization, rather than purely speculative trading.
- Leverage & Capital Efficiency (Lending + Flash Loans):
- Flash Loans (Borrowing and Repayment): $1.3 trillion. These rapid, uncollateralized loans are primarily used for automated arbitrage and liquidation cycles.
- Lending Activity (Supply, Borrow, Repay, Withdraw): $137 billion. This segment signifies on-chain short-term capital efficiency and structured credit mechanisms.
- Access Channels (CEX and Bridges):
- CEX Traffic (Deposits, Withdrawals, Internal Transfers): Totaling $599 billion ($224 billion in deposits, $224 billion in withdrawals, $151 billion in internal transfers).
- Cross-Chain Bridge Deposits & Withdrawals: $28 billion.
These substantial flows demonstrate stablecoins’ critical role in facilitating transfers between centralized exchanges and enabling seamless cross-chain settlement.
- Issuance Layer (Monetary Operations):
- Issuer Operations (Minting, Burning, De-peg Adjustment, Other Activities): Totaling $106 billion ($28 billion in minting, $20 billion in burning, $23 billion in de-peg adjustments). This figure is almost five times the $42 billion recorded in the previous year, reflecting dynamic monetary operations.
- Yield Protocols:
- Yield Protocol Activity: $2.7 billion. While smaller in scale, this segment is structurally significant, closely linked to structured strategies and sophisticated on-chain asset management.
Overall, an impressive 90% of stablecoin transfer volume is mapped to identified activity categories, providing a granular and nuanced understanding of how stablecoins flow through every layer of the on-chain technical stack.
Velocity: The Same Token, Different Worlds
Perhaps the most underestimated metric in stablecoin analysis is daily turnover (transfer volume divided by supply). This powerful indicator reveals how actively a stablecoin functions as a medium of exchange, rather than merely being held as a store of value.
Among the tokens analyzed, USDC and USDT once again stand out, though with distinct usage patterns.
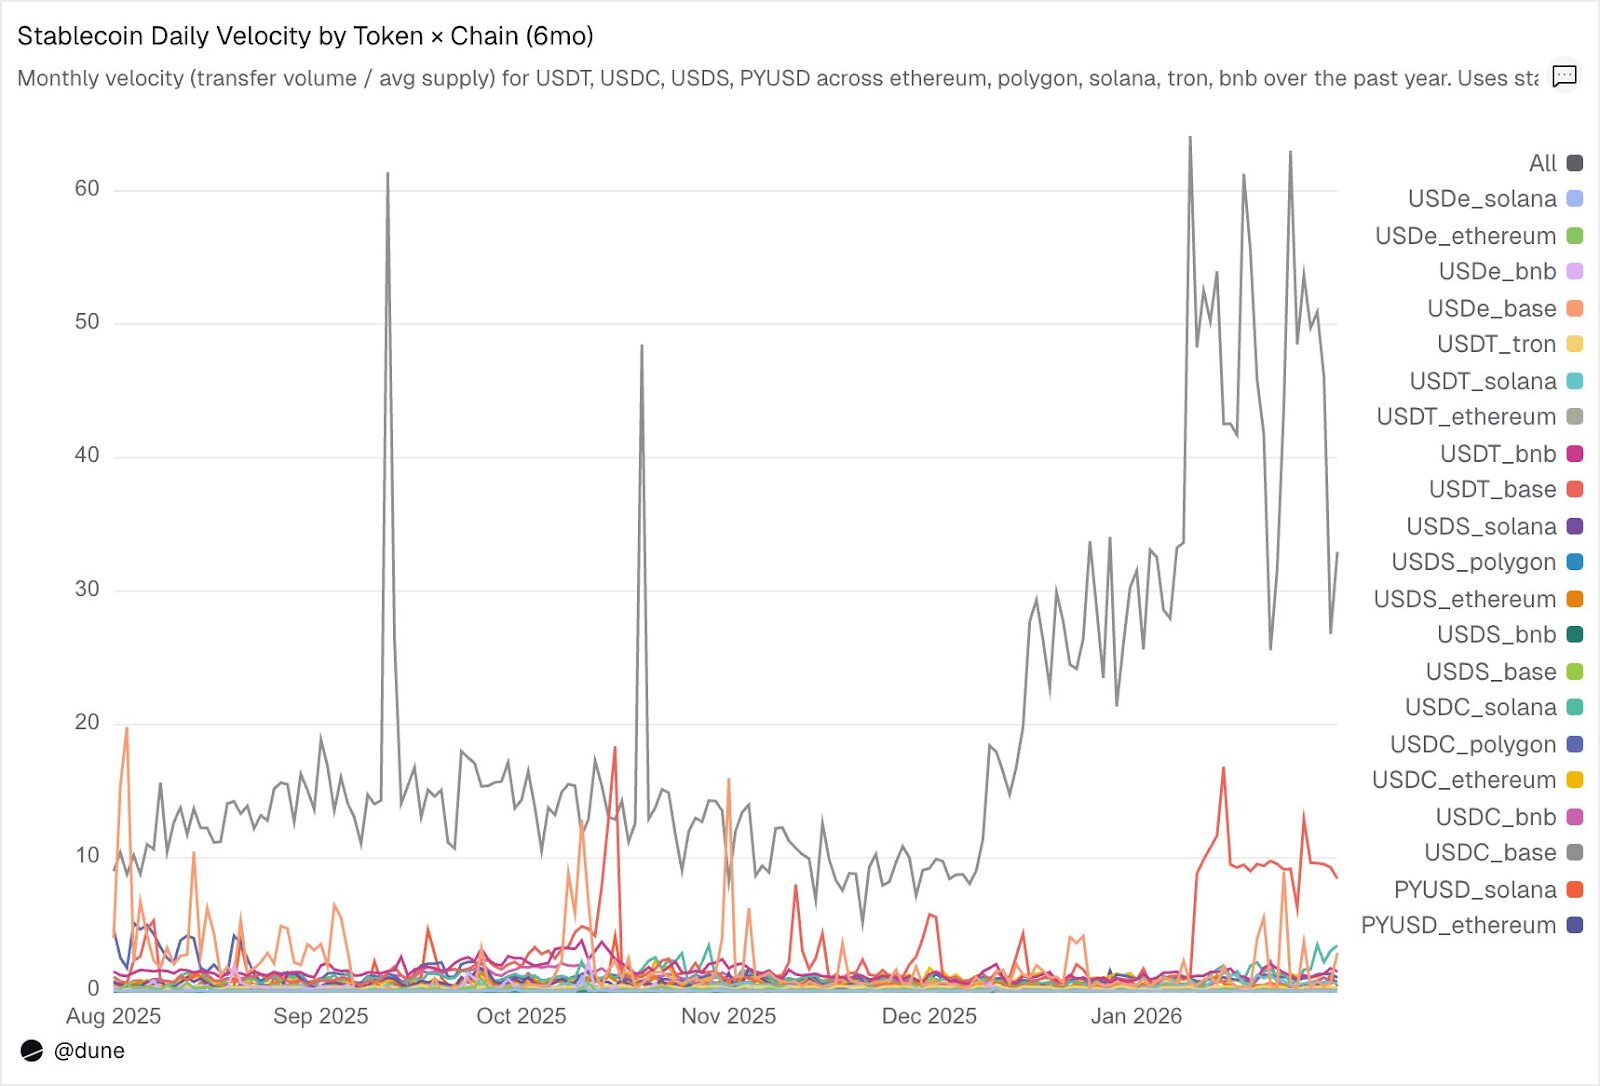
USDC exhibits the fastest velocity on Layer 2s and Solana. On Base, USDC’s average daily velocity reached an astonishing 14x, primarily driven by high-frequency DeFi trading activities. On Solana and Polygon, it hovers around 1x, while on Ethereum, it reaches 0.9x, indicating that nearly its entire supply is traded daily.
Conversely, USDT demonstrates its highest velocity on BNB Chain and Tron. BNB Chain recorded an average daily velocity of 1.4x, reflecting active trading. Tron’s average daily velocity was 0.3x, with lower but exceptionally stable trading volume, consistent with its established role as a primary channel for cross-border payments. On Ethereum, however, USDT’s average daily velocity is only 0.2x, suggesting that over $100 billion of its supply largely remains idle.
For yield-bearing stablecoins like USDe and USDS, a slower transaction velocity is an intentional design feature, not a drawback. USDe on Ethereum registered a daily velocity of just 0.09x, while USDS had a daily velocity of 0.5x. Both are engineered to accumulate yield: USDe is typically staked into sUSDe to capture Ethena’s delta-neutral strategy yield, and USDS is deposited into the Sky Savings Rate for protocol-funded returns. Consequently, a significant portion of their supply remains held in savings contracts, lending markets like Aave, or within structured yield loops. Their low velocity is, in fact, an advantage, as these assets are designed for accumulation rather than rapid circulation.
Crucially, the underlying blockchain often dictates usage patterns more than the token itself. PYUSD on Solana boasts a daily velocity of 0.6x, four times higher than its velocity on Ethereum (0.1x). This illustrates how the same token can exhibit vastly different usage behaviors across diverse ecosystems.
While supply and transfer volume each offer partial insights, velocity serves as the crucial link, providing a single metric to gauge whether a stablecoin on a particular chain functions as active infrastructure or as passive, idle capital.
Beyond the Dollar: The Global Stablecoin Landscape
While this analysis primarily focuses on 15 USD-denominated stablecoins, Dune’s comprehensive dataset extends far beyond, tracking over 200 stablecoins representing more than 20 distinct fiat currencies. This includes the Euro (17 tokens, $990 million supply), Brazilian Real ($141 million), Japanese Yen ($13 million), and tokens denominated in Nigerian Naira, Kenyan Shilling, South African Rand, Turkish Lira, Indonesian Rupiah, Singapore Dollar, and many others.
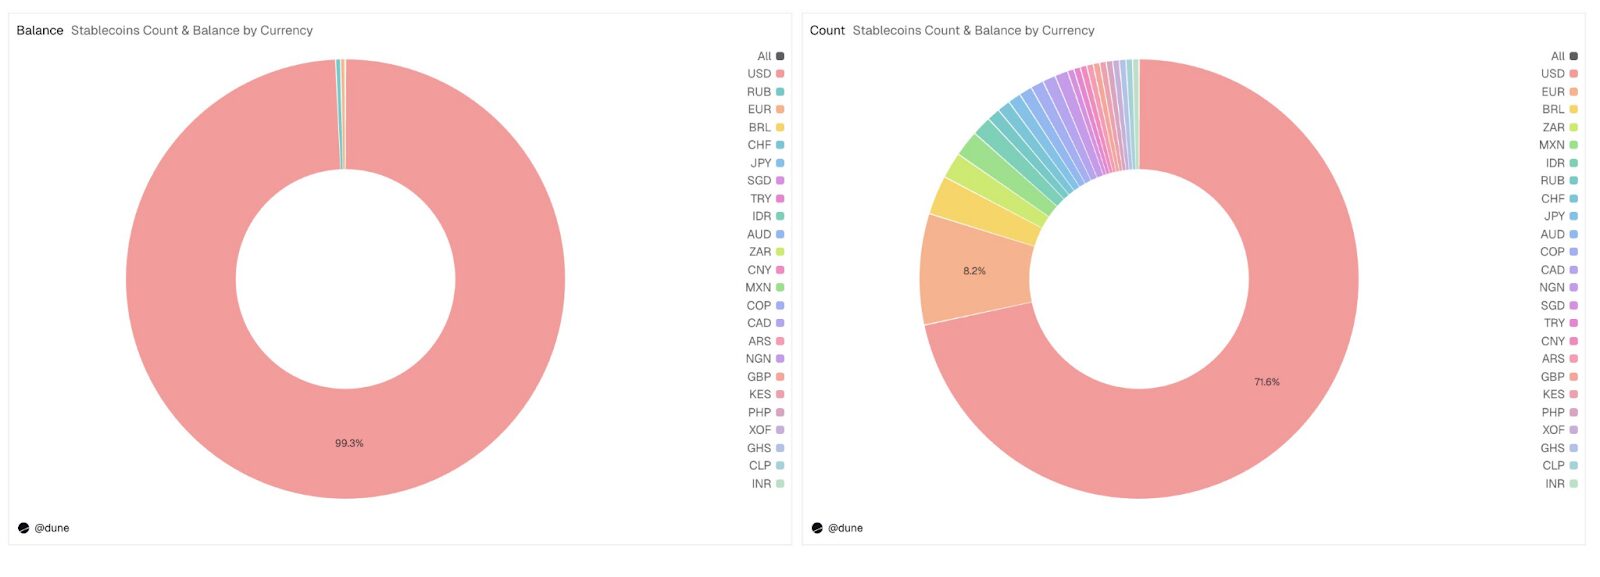
Although the current supply of non-USD stablecoins stands at a modest $1.2 billion, the presence of 59 tokens distributed across six continents—comprising nearly 30% of the total tokens in the dataset—signals a burgeoning trend. The foundational infrastructure for local currency stablecoins is actively being built on-chain, and the data to meticulously track their global development is now readily available.
The hidden war of stablecoins: Issuers, applications, and users, who can become the “biggest winner”?
(The above content is an excerpt and reproduction authorized by our partner PANews. Original Article Link)
Disclaimer: This article is provided for market information purposes only. All content and views are for reference and informational purposes only and do not constitute investment advice. They do not represent the views or positions of Blockcast. Investors should make their own investment decisions and conduct their own trades. The author and Blockcast will not be held responsible for any direct or indirect losses incurred by investors as a result of their transactions.