
Author: Frank, PANews
In the often-perplexing phases of the market, where uncertainty reigns, a common tendency emerges: the attempt to predict future movements by rigidly applying past patterns. This approach, often likened to “carving a boat to find a sword” (a Chinese idiom for clinging to outdated methods), suggests that history consistently repeats itself, allowing us to superimpose past market trajectories onto current and future trends. Such historical pattern matching often appears to possess an almost magical predictive power, frequently validated by proponents who claim accuracy rates as high as 75-80%.
But does this widely popular method truly help market participants identify crucial phases, or is it merely packaging noise as prophecy? This article delves into the mechanics, perceived successes, and critical limitations of these “déjà vu” market predictions.
From “Tick-Tock Fractals” to “History Rhymes”
The “Tick-Tock Fractal” and CryptoBullet’s 2025 Peak Prediction
One prominent example of historical pattern prediction comes from analyst CryptoBullet, who in May 2025, used his “tick-tock fractal” analysis method to forecast a Bitcoin market peak in October of the same year. This model successfully anticipated the end of the bull market, though his price target of $150,000 ultimately overshot the actual high of $126,000.
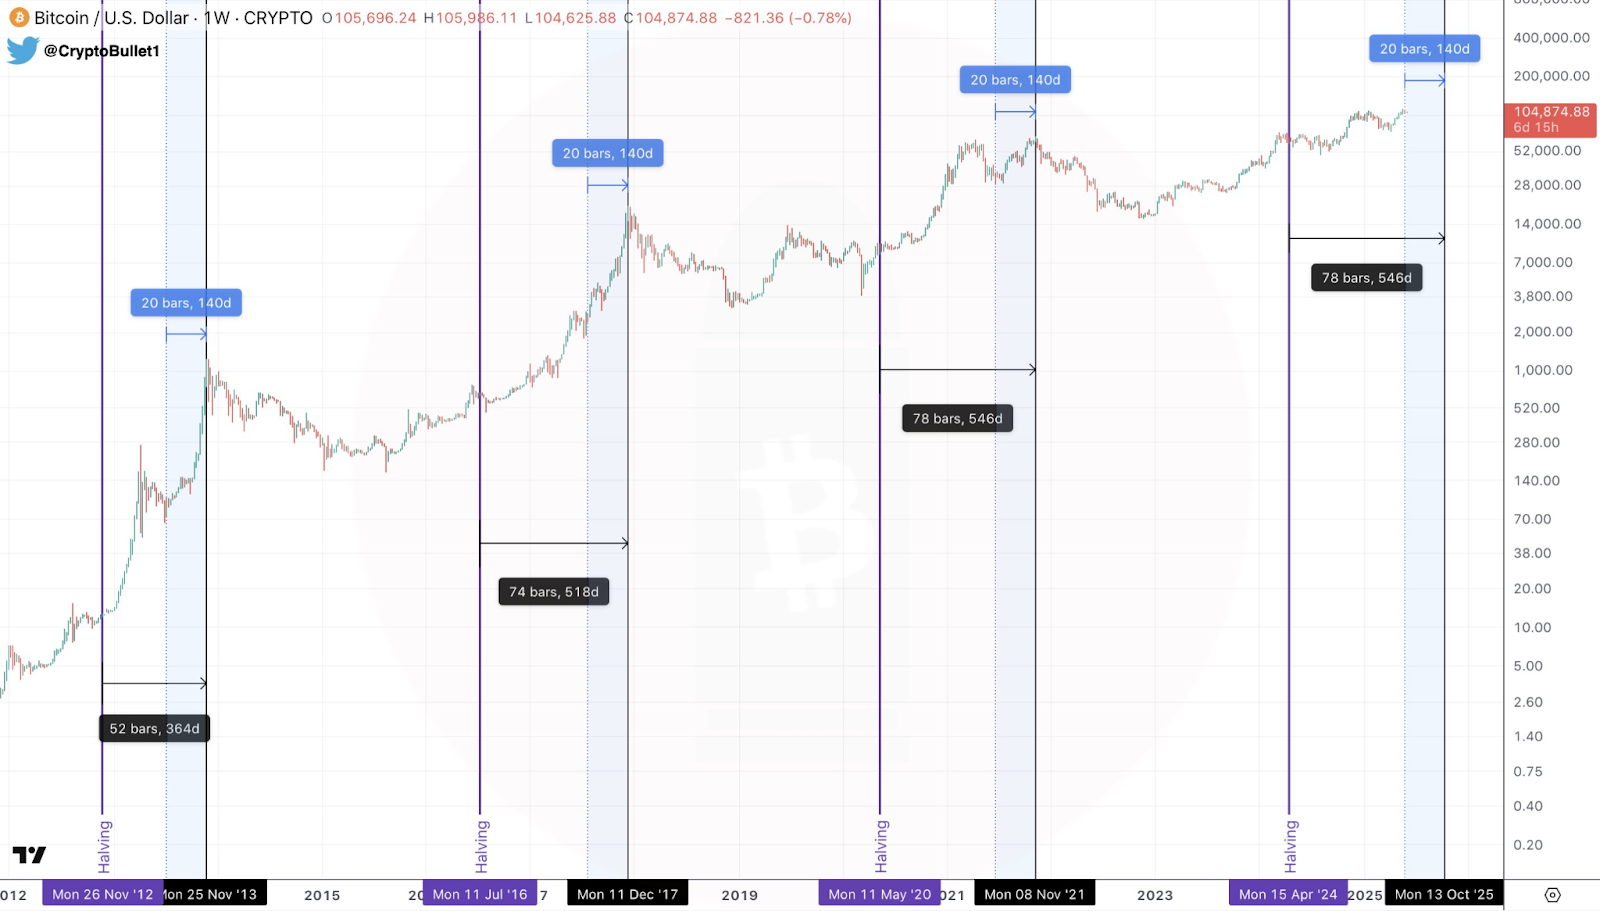
CryptoBullet’s methodology primarily hinged on the observation that in previous cycles, specific timeframes post-halving frequently coincided with market tops. His logic posited that if the market entered a similar window, then projecting similar time intervals and price developments would lead to an October peak at $150,000. While his temporal prediction proved remarkably accurate, the specific price target remained elusive.
KillaXBT and the Philosophy That “History Rhymes”
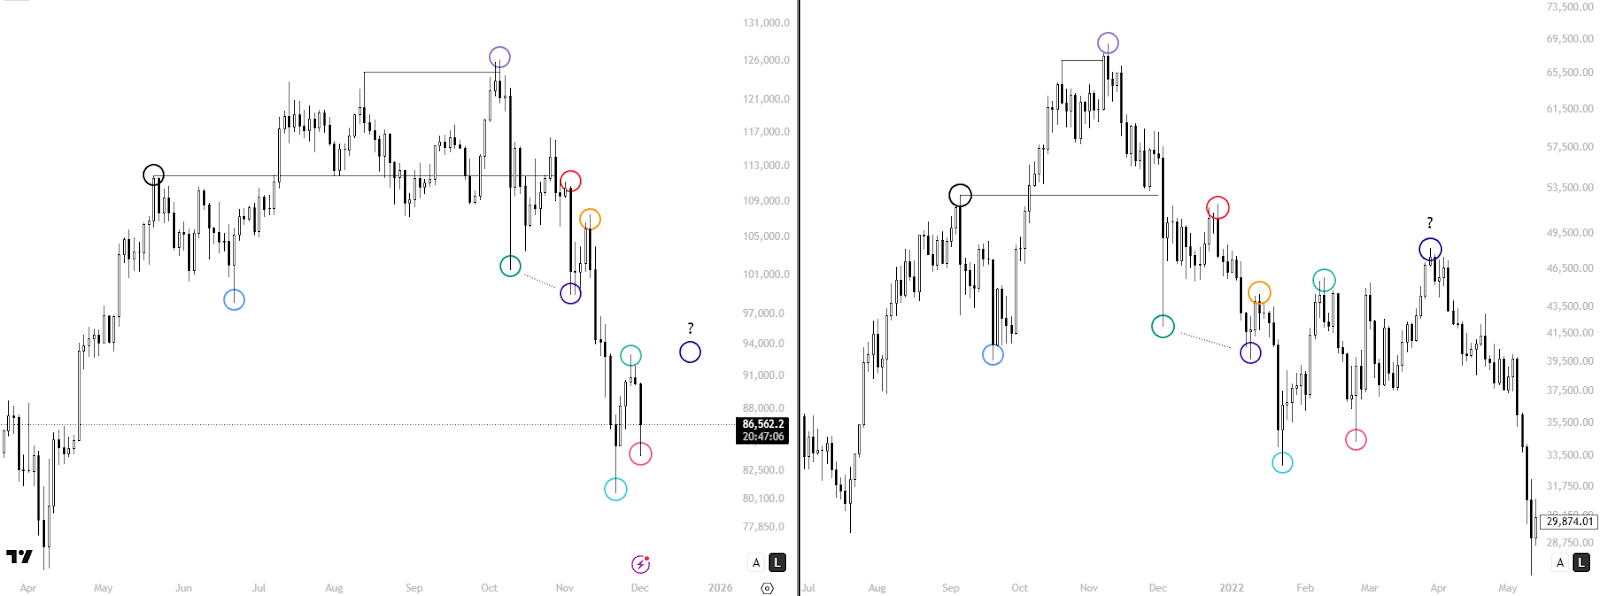
Another influential figure, KillaXBT, operates on the core principle that history doesn’t repeat precisely but often “rhymes.” His approach integrates time cycles, historical pivot windows, and structural symmetry to adapt to current market conditions. Rather than forcing rigid proportional relationships across all timeframes, KillaXBT compares current price action and trends with specific historical phases, offering more ambiguous predictions about potential future movements—typically focusing on general direction (up or down) rather than precise price points or specific dates.
KillaXBT boldly claims an impressive 75-80% accuracy rate for his predictions. Let’s examine a few of his recent calls:
- December 2025: KillaXBT analyzed the price action, noting its high similarity to 2021. He predicted a potential dip to $80,000, followed by a breakout above $90,000. While the price didn’t fall below $80,000, it did eventually break above $90,000, even reaching nearly $98,000. Although the exact price was not hit, the overall trend closely mirrored his simulated 2021 period.
- January 2026: Employing a different statistical approach based on the past seven months, KillaXBT observed an average 8% decline within two weeks after the 14th of each month. Consequently, he predicted a potential market downturn of at least 8% after January 14.
- February 2026: KillaXBT once again predicted a scenario mirroring 2022. He suggested a potential surge before another downward break below $60,000, forming a bottoming range. While this prediction is yet to be fully validated, the recent rebound to around $74,000 does align with parts of his projected trajectory.
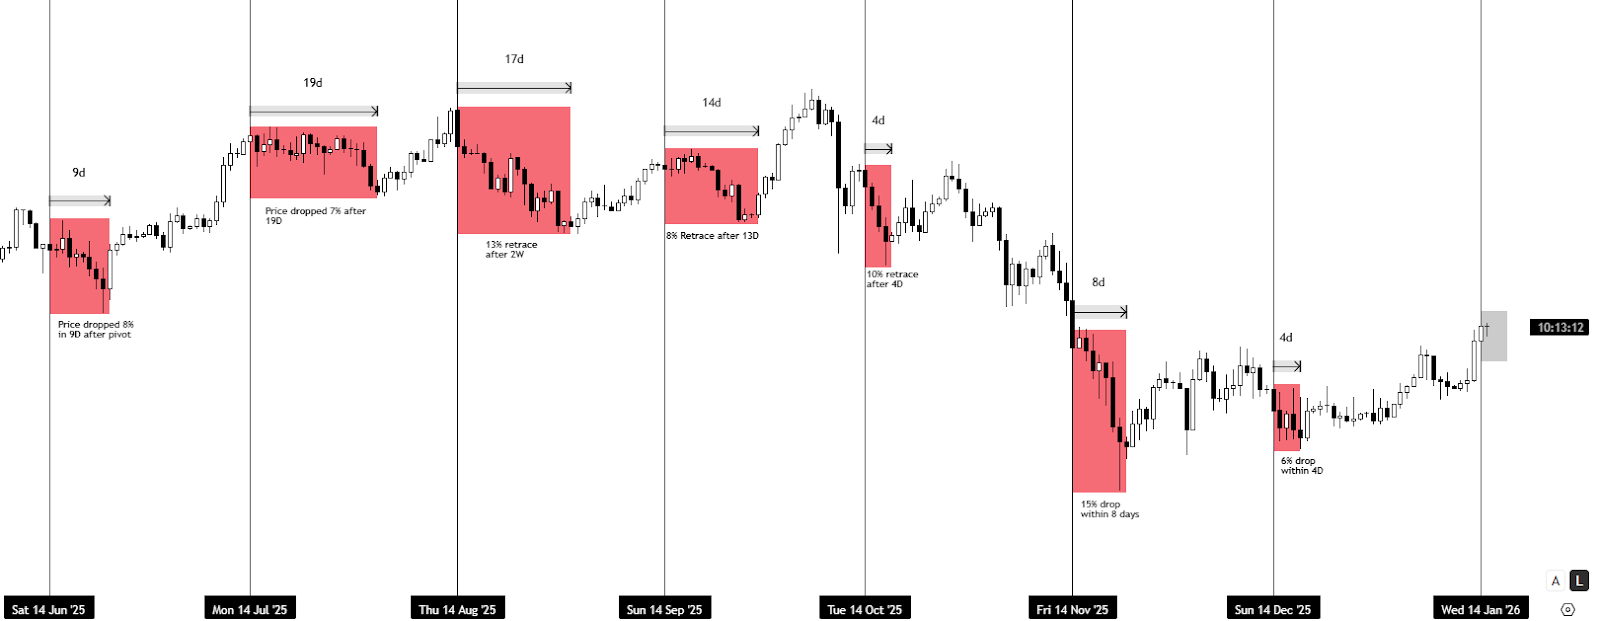
This prediction also demonstrated remarkable accuracy. After a brief market peak on January 15, a rapid downward channel indeed emerged, with a maximum decline exceeding 38%.
At first glance, KillaXBT’s predictions appear quite accurate, garnering him significant attention and a substantial following.
Mysticism or Science? The Three Pillars of “High Accuracy”
The crucial question then arises: why do these “carving a boat” style predictions often seem accurate? Is it mere mysticism, or is there a scientific basis?
1. The Cyclical Nature of Market Sentiment and Liquidity
History does indeed “rhyme” because the underlying structure of market movements is fundamentally driven by recurring patterns of liquidity and market sentiment. Concepts like the Wyckoff Method, which categorizes market phases into accumulation, markup, distribution, and markdown, illustrate this cyclicality. The repetition of market evolution is essentially the repetition of human emotions—from panic to euphoria, and back again. This inherent psychological ebb and flow creates recognizable patterns, allowing for analogous comparisons.
2. Parallels with Established Technical Indicators
The predictive efficacy of these pattern-matching methods is not exclusive. Most commonly used technical indicators, such as MACD, RSI, and trendlines, often provide similar warning signals at market tops and bottoms. However, these traditional tools lack the “mystery” and intuitive visual appeal of a direct historical overlay. While indicators might show divergence or overbought/oversold conditions, they don’t offer the same direct visual representation of a “specific structural movement” (e.g., “an initial rise followed by a fall”) that pattern-matching charts do. Humans are naturally drawn to such intuitive and simplified representations.
3. The Pervasive Influence of Survivorship Bias
A significant factor contributing to the perceived high accuracy is survivorship bias, eloquently illustrated by the “infinite monkeys and typewriters” analogy from Nassim Nicholas Taleb’s Fooled by Randomness. While these analysts aren’t simply random, the sheer volume of predictions made daily on social media means that erroneous forecasts are either ignored or quietly deleted. The successful predictions that remain and gain recognition are, to a large extent, products of fortunate deviation. For Key Opinion Leaders (KOLs), the objective is often traffic and engagement; for actual traders, it’s tangible account profit and loss. This style of prediction isn’t new; previous cycles saw numerous similar theories, such as TechDev overlaying Bitcoin’s monthly charts with the 2013 cycle and 1970s gold movements to predict a $200,000-$390,000 peak, or PlanB extrapolating halving rhythms to $100,000 using stock-to-flow models. Most of these “prophets” eventually faltered, losing their relevance. As old seers are discarded by the market, new “line-drawing masters” emerge with their fresh mystique.
Predicting Direction ≠ Trading Strategy: The Fatal Flaws in Practice
Beyond their perceived accuracy, a more critical question remains: are these “carving a boat” predictions genuinely effective for practical trading?
Let’s revisit our earlier examples:
- CryptoBullet’s October 2025 Peak at $150,000: In real-world trading, factors like price direction, precise timing, take-profit/stop-loss levels, and position management are paramount. CryptoBullet’s prediction offered only a relatively vague timeframe and an incorrect price target. As an actionable trading strategy, its reference value was limited. It’s nearly impossible to accurately initiate a short position in early October based solely on a “peak in October” call, as it provided no clear entry point or invalidation conditions. A trader acting too early might have been stopped out during the final surge, and by the time the market genuinely showed signs of weakness, the prediction merely served as a hindsight validation that the “time window was roughly right,” rather than a direct, executable trading system.
- KillaXBT’s December 2025 Prediction: This prediction offered more of a directional judgment than an execution manual. It suggested a “likely dip followed by an upward breakout” but failed to specify whether to enter a long position near $82,000, $80,000, or $78,000, nor did it define a price point where the analogy would be invalidated. For long-term investors, such a judgment might help maintain conviction and prevent panic selling during a downturn. However, for traders requiring precise entry and exit points, it lacked critical execution information.
- KillaXBT’s January 2026 Prediction: While perhaps his most accurate, the price decline only began after January 15. Placing an order based on such a prediction could easily lead to a stop-loss being hit by an initial upward movement. Moreover, this prediction structure lacked specific price information, making it impossible to set effective stop-loss or take-profit orders based solely on the model.
In summation, these “carving a boat” predictions function more as phase identification tools than directly repeatable trading strategies. They can occasionally assist in identifying risk zones and sentiment turning points, offering some directional insight. However, when packaged as high-certainty prophecies, their inherent flaws quickly become apparent.
History may rhyme, but it never photocopies.
For the average investor, the true value lies not in a single “magic chart,” but in understanding the underlying shifts in sentiment, liquidity, and market structure that these charts attempt to highlight. The real danger lies in mistaking a vague phase judgment for a precise, actionable trading command.
(The above content is an authorized excerpt and reproduction from our partner PANews. Original Article Link)
Disclaimer: This article is for market information purposes only. All content and opinions are for reference only and do not constitute investment advice. They do not represent the views and positions of the Blocker. Investors should make their own decisions and trades. The author and the Blocker will not be liable for any direct or indirect losses incurred by investors’ transactions.