
The third quarter of 2025 marked a pivotal juncture for the crypto market. It capitalized on a robust rebound in risk assets initiated in July, solidifying a macroeconomic turning point following September’s interest rate cuts. However, as the fourth quarter unfolded, market sentiment sharply reversed. A confluence of escalating macroeconomic uncertainties and intrinsic structural risks within the crypto sphere shattered earlier optimistic projections.
The deceleration in inflation’s retreat, coupled with an unprecedented U.S. federal government shutdown in October and intensified fiscal disputes, sent ripples of uncertainty through global markets. The latest FOMC meeting minutes explicitly cautioned against “premature rate cuts,” causing a dramatic recalibration of policy expectations. The once-clear narrative of an “imminent rate cut cycle” quickly eroded, compelling investors to re-evaluate risks such as “higher rates for longer” and “soaring fiscal instability.” This repeated oscillation in rate cut expectations significantly amplified volatility across risk assets, while the Federal Reserve deliberately worked to temper excessive market optimism, preventing an untimely easing of financial conditions.
The prolonged government shutdown compounded these policy uncertainties, exerting a dual pressure on economic activity and financial liquidity:
- Significant GDP Drag: The Congressional Budget Office estimated a 1.0%–2.0% reduction in Q4 2025 real GDP annualized growth due to the shutdown, translating into billions of dollars in economic losses.
- Critical Data Gaps & Liquidity Contraction: The shutdown halted the release of vital economic data like non-farm payrolls, CPI, and PPI, plunging the market into a “data blind spot.” This obscured economic and policy judgments. Simultaneously, disrupted federal spending inadvertently tightened short-term liquidity, broadly impacting risk assets.
By November, discussions intensified within the U.S. stock market regarding potential overvaluation in the AI sector. This led to increased volatility in high-growth tech stocks, dampening overall risk appetite. Consequently, crypto assets struggled to gain spillover support from the broader equity market. While proactive pricing of rate cuts in Q3 had initially fueled risk-taking, this “liquidity-driven optimism” was notably diminished in Q4 by the persistent government shutdown and recurring policy ambiguities. Risk assets collectively entered a new phase of repricing.
Amidst rising macroeconomic uncertainty, the crypto market confronted its own set of structural challenges. The period between July and August saw both Bitcoin and Ethereum achieve significant milestones, with Bitcoin surpassing $120,000 and Ethereum reaching approximately $4,956 by late August, fostering a wave of positive market sentiment.
However, this bullish momentum was abruptly halted by the massive Binance liquidation event on October 11, which delivered one of the most severe systemic shocks to the crypto industry:
- By November 20, both Bitcoin and Ethereum had undergone substantial corrections from their peaks. This eroded market depth and exacerbated the divergence between long and short positions.
- The ensuing liquidity crunch from the liquidations severely undermined overall market confidence. Early Q4 witnessed a noticeable decline in market depth, while the ripple effects of the liquidations intensified price volatility and elevated counterparty risks across the ecosystem.
Compounding these issues, fund inflows into spot ETFs and Digital Asset Treasury (DAT) strategies significantly decelerated in Q4. Insufficient institutional buying power struggled to counteract the selling pressure from liquidations, pushing the crypto market from late August into a phase of high-level rotation and consolidation, ultimately culminating in a more pronounced corrective trend.
Reflecting on Q3, the crypto market’s ascent was driven by two primary factors: a resurgence in overall risk appetite and the positive influence of publicly listed companies adopting Digital Asset Treasury (DAT) strategies. These strategies significantly enhanced institutional acceptance of crypto asset allocation and improved the liquidity profiles of various assets, emerging as a central narrative for the quarter. However, as Q4 brought a tighter liquidity environment and exacerbated price retracements, the sustained buying pressure associated with DAT initiatives began to wane.
At its core, the DAT strategy involves corporations integrating tokenized assets onto their balance sheets, leveraging on-chain liquidity, yield aggregation, and staking mechanisms to boost capital efficiency. With a growing number of listed companies and funds exploring partnerships with stablecoin issuers, liquidity protocols, and tokenization platforms, this model is rapidly transitioning from theoretical exploration to practical implementation. This evolution has fostered a convergence of “token-equity-asset” boundaries across various digital assets like ETH, SOL, BNB, ENA, and HYPE, underscoring the role of digital asset treasuries as a crucial bridge within the macroeconomic liquidity cycle.
Nevertheless, the prevailing market conditions saw innovative valuation frameworks tied to DAT, such as market-to-net-asset-value (mNAV), generally fall below 1. This indicates a market discount on the underlying on-chain asset net value. This trend highlights investor concerns regarding the liquidity, yield stability, and long-term valuation sustainability of these assets, suggesting that the asset tokenization process faces considerable short-term adjustment pressures.
At the sector level, several segments demonstrated persistent growth momentum:
- Stablecoins: The stablecoin sector continued its expansion, surpassing $297 billion in total market capitalization. Its role as a reliable capital anchor intensified amidst the uncertain macroeconomic environment.
- Perpetual Futures (Perps): Represented by innovative platforms like HYPE and ASTER, the Perp sector witnessed a significant boost in activity through novel trading structures, including on-chain order matching, optimized funding rates, and layered liquidity mechanisms. This made it a key beneficiary of capital rotation during the quarter.
- Prediction Markets: Amidst fluctuating macroeconomic expectations, prediction markets experienced a resurgence. Platforms like Polymarket and Kalshi recorded record trading volumes, solidifying their role as real-time barometers of market sentiment and risk appetite.
The rise of these sectors signals a broader shift in capital allocation, moving away from singular price speculation towards structured strategies centered on “liquidity efficiency, yield generation, and information pricing.”
Overall, the Q3 divergence in momentum between the crypto and U.S. equity markets culminated in Q4 as a concentrated exposure to structural risks and a pervasive increase in liquidity pressure. The government shutdown not only delayed crucial macroeconomic data but also amplified fiscal uncertainty, eroding overall market confidence. Meanwhile, debates surrounding AI valuations fueled volatility in U.S. equities, while the crypto market faced more direct shocks to liquidity and depth following the Binance liquidation. The concurrent slowdown in DAT fund inflows and mNAV generally falling below 1 underscored the market’s acute sensitivity and vulnerability to liquidity conditions during its institutionalization phase. The path to stabilization will largely hinge on the speed at which the market digests the impact of the liquidation event and its ability to gradually restore liquidity and emotional equilibrium amidst widening long-short divergences.
Rate Cut Expectations Materialize, Market Enters Repricing Phase
The third quarter of 2025 saw the global macroeconomic narrative dominated not by the act of interest rate cuts themselves, but by the intricate process of their anticipation, trading, and eventual realization. The market began pricing in a liquidity turning point as early as July, rendering the actual policy actions more of a validation of existing consensus than a fresh catalyst.
After two quarters of intense speculation, the Federal Reserve ultimately reduced the federal funds rate target range by 25 basis points to 4.00%–4.25% at its September FOMC meeting, followed by another minor cut in October. However, given the market’s prior, highly concentrated bets on rate cuts, the marginal impact of these policy moves on risk assets was limited; their signaling effect had largely been absorbed into prices. Concurrently, as inflation’s descent slowed and economic resilience surpassed expectations, the Fed began to explicitly voice concerns about the market “prematurely pricing in continuous rate cuts for the following year.” This led to a notable decrease in the probability of a further December rate cut after October, turning the Fed’s cautious communication into a new factor dampening market risk appetite.
Macroeconomic data during Q3 reflected a “mild cooling” trend:
- Core CPI year-on-year declined from 3.3% in May to 2.8% in August, confirming a downward trajectory for inflation.
- Non-farm payroll additions consistently remained below 200,000 for three consecutive months.
- The job vacancy rate retreated to 4.5%, marking its lowest point since 2021.
This data set indicated that the U.S. economy was not entering a recession but rather a controlled slowdown, providing the Federal Reserve with the flexibility for “manageable rate cuts.” Consequently, a consensus around “certain rate cuts” had firmly formed in the market by early July.
According to the CME FedWatch Tool, investor probability for a 25 basis point rate cut in September surpassed 95% by late August, signifying that the market had almost entirely priced in this expectation well in advance. The bond market echoed this sentiment:
- The 10-year U.S. Treasury yield decreased from 4.4% at the quarter’s outset to 4.1% by its close.
- The 2-year yield saw an even more significant decline of approximately 50 basis points, reflecting a more concentrated market bet on a policy pivot.
The macroeconomic turning point in Q3 was therefore more about the “digestion of expectations” than a sudden “shift in policy.” The repricing of liquidity repair was largely completed between July and August, with September’s actual rate cut merely serving as a formal affirmation of an already established consensus. For risk assets, the new marginal variable transitioned from “whether rates would be cut” to “the pace and sustainability of future rate cuts.”
However, once the rate cuts materialized, the marginal impact of these expectations was fully exhausted, and the market quickly entered a “catalyst-free vacuum” phase.
From mid-September, macroeconomic indicators and asset price movements showed a distinct flattening:
- Flattening Yield Curve: By the end of September, the 10-year – 3-month Treasury spread was only about 14 basis points, indicating that while a term premium persisted, the risk of inversion had dissipated.
- Dollar Weakness: The U.S. Dollar Index retreated to the 98–99 range, a significant weakening from its year-start high of 107, though USD funding costs remained notably tight during quarter-end settlements.
- Slowing Equity Inflows: While the Nasdaq Composite continued its upward trend, ETF inflows decelerated, and trading volume growth was sluggish, suggesting institutions had begun adjusting risk exposures at higher valuations.
This “vacuum period post-expectation realization” became the most representative macroeconomic phenomenon of the quarter. The market spent the first half trading on “rate cut certainty” and the second half pricing in “the reality of slowing growth.”
The Federal Reserve’s September meeting’s Summary of Economic Projections (SEP), or dot plot, revealed clear internal divergences among policymakers regarding the future interest rate trajectory:
- The median policy rate forecast for year-end 2025 was adjusted downwards to 3.9%.
- Individual committee member forecasts ranged from 3.4%–4.4%, reflecting differing views on inflation persistence, economic resilience, and policy flexibility.
Following the September and subsequent October rate cuts, the Fed’s communication adopted an increasingly cautious tone, aiming to prevent an premature loosening of financial conditions. This shift significantly reduced the previously highly anticipated probability of another December rate cut, re-anchoring the policy path to a “data-dependent” framework rather than a “preset rhythm.”
Unlike earlier “crisis-driven easing” cycles, this round of rate cuts represented a controlled policy adjustment. The Federal Reserve simultaneously cut rates and continued its balance sheet reduction, signaling a focus on “stabilizing capital costs and suppressing inflation expectations,” prioritizing a balance between growth and price stability over active liquidity expansion. In essence, while the interest rate turning point was established, a broader liquidity turning point had not yet arrived.
Against this backdrop, the market exhibited clear bifurcation. Lower financing costs provided valuation support for select high-quality assets, yet overall liquidity did not expand significantly, leading to a more cautious capital allocation approach.
- Sectors underpinned by robust cash flows and strong earnings (e.g., AI, tech blue-chips, and some DAT-affiliated U.S. stocks) continued their valuation recovery.
- Assets characterized by high leverage, elevated valuations, or a lack of cash flow support (including certain growth stocks and non-mainstream crypto tokens) saw their momentum diminish after expectations were met, resulting in a noticeable decline in trading activity.
In summary, Q3 2025 was a “period of expectation realization,” not a “period of liquidity liberation.” The market initially priced in rate cut certainty, then pivoted to a reassessment of slowing growth. The early consumption of these expectations meant that while risk assets maintained elevated levels, they lacked sustained upward momentum. This macroeconomic landscape laid the groundwork for subsequent structural differentiation, explaining the crypto market’s Q3 trajectory of “breakout—pullback—high-level consolidation”: capital gravitated towards relatively stable, cash-flow-verifiable assets, rather than those exposed to systemic risks.
The Rise of Non-Bitcoin Digital Asset Treasuries (DAT) and a Structural Pivot
In Q3 2025, Digital Asset Treasury (DAT) strategies transcended their niche origins within the crypto industry to become one of the fastest-spreading themes across global capital markets. This quarter marked an unprecedented convergence, with public market capital flowing into crypto assets simultaneously in terms of both scale and mechanism. Billions of dollars in fiat liquidity were channeled directly into the crypto market via traditional financing instruments like Private Investment in Public Equity (PIPE), At-the-Market (ATM) offerings, and convertible bonds, forging a structured trend of “crypto-equity linkage.”
The genesis of the DAT model can be traced to MicroStrategy (NASDAQ: MSTR), a pioneer in traditional markets. Starting in 2020, MicroStrategy led the way by incorporating Bitcoin onto its corporate balance sheet. Between 2020 and 2025, through multiple rounds of convertible bond and ATM issuances, the company cumulatively acquired approximately 640,000 Bitcoins, representing a total investment exceeding $47 billion. This strategic maneuver not only reconfigured the company’s asset structure but also established a groundbreaking precedent for traditional equities serving as a “secondary vehicle” for crypto asset exposure.
Owing to inherent systemic differences in valuation logic between equity markets and on-chain assets, MicroStrategy’s stock price consistently traded above its Bitcoin net asset value. Its market-to-net-asset-value (mNAV) ratio (market capitalization / on-chain asset net value) typically hovered in the 1.2–1.4x range. This “structural premium” illuminates the core mechanism of DAT:
By leveraging public market financing to hold crypto assets, enterprises facilitate a bidirectional interplay and valuation feedback loop between fiat capital and crypto assets at the corporate level.
Mechanistically, MicroStrategy’s pioneering experiment established three fundamental pillars for the DAT model:
- Financing Channel: Introducing fiat liquidity via PIPE, ATM, or convertible bonds to fund corporate on-chain asset allocations.
- Asset Reserve Logic: Integrating crypto assets into financial reporting frameworks, thereby creating an enterprise-grade “On-Chain Treasury.”
- Investor Gateway: Offering traditional capital market investors indirect exposure to crypto assets through equity holdings, effectively lowering compliance and custody barriers.
These three elements collectively form the DAT “structural cycle”: financing, holding, and valuation feedback. Corporations harness traditional financial instruments to absorb liquidity, build crypto asset reserves, and then leverage the equity market’s premium to enhance capital, achieving a dynamic rebalancing between capital and tokenized assets.
The profound significance of this structure lies in its groundbreaking achievement: enabling digital assets to enter the balance sheets of traditional financial systems in a compliant manner for the first time. It bestows upon capital markets an entirely new asset class—”tradable on-chain asset mapping.” In essence, enterprises are no longer mere on-chain participants but have evolved into structural intermediaries bridging fiat capital and crypto assets.
As this validated model rapidly proliferated, Q3 2025 heralded the second phase of DAT’s conceptual diffusion: expanding beyond Bitcoin-centric “store-of-value treasuries” to encompass productive assets like Ethereum (ETH) and Solana (SOL), which generate PoS or DeFi yields. This new generation of DAT models, anchored by the mNAV valuation system, integrates yield-bearing assets into corporate cash flow and valuation methodologies, establishing a “yield-driven treasury cycle.” Unlike earlier Bitcoin treasuries, assets such as ETH and SOL offer sustainable staking yields and vibrant on-chain economic activity, endowing their treasury holdings with both store-of-value and cash-flow characteristics. This evolution signifies DAT’s transition from passive asset holding to an innovative stage of capital structuring centered on productive yield, becoming a critical link between the value of productive crypto assets and traditional capital market valuation frameworks.
Note: Entering November 2025, a fresh downturn in the crypto market triggered the most systematic valuation repricing of the DAT sector since its inception. With core assets like ETH, SOL, and BTC experiencing rapid corrections of 25–35% in October–November, compounded by the short-term dilutive effects of some DAT companies accelerating balance sheet expansion via ATM offerings, the mNAV of leading DAT enterprises generally fell below 1. Companies such as BMNR, SBET, and FORD all experienced varying degrees of “discount trading” (mNAV ≈ 0.82–0.98). Even MicroStrategy (MSTR), which had long maintained a structural premium, saw its mNAV briefly dip below 1 in November—a first since its Bitcoin treasury strategy launched in 2020. This phenomenon signals a market shift from a period of structural premium to a defensive phase characterized by “asset-led, valuation discount.” Institutional investors widely perceive this as the DAT industry’s inaugural comprehensive “stress test,” reflecting a capital market that is rigorously re-evaluating the sustainability of on-chain asset yields, the prudence of treasury expansion pacing, and the long-term impact of financing structures on equity value.
SBET and BMNR Lead the Ethereum Treasury Wave
The third quarter of 2025 saw the initial establishment of the Ethereum Digital Asset Treasury (ETH DAT) market landscape. SharpLink Gaming (NASDAQ: SBET) and BitMine Immersion Technologies (NASDAQ: BMNR) emerged as two pioneering companies, defining the industry paradigm. Beyond merely replicating MicroStrategy’s balance sheet strategy, they achieved a significant leap “from concept to institutionalization” in financing structures, institutional participation, and information disclosure standards, thereby constructing the dual pillars of the ETH treasury cycle.
BMNR: The Capital Engineering Behind Ethereum Treasury
As of the end of September 2025, BitMine Immersion Technologies (BMNR) had solidified its position as the world’s largest Ethereum Treasury. According to the company’s latest disclosures, it held approximately 3,030,000 ETH. At the October 1 closing price of $4,150/ETH, this equated to an on-chain net asset value of approximately $12.58 billion. Including the company’s cash on hand and other liquid assets, BMNR’s total crypto and cash holdings stood at approximately $12.9 billion.
This holding represents an estimated 2.4–2.6% of Ethereum’s circulating supply, making BMNR the first single listed institution to hold over 3 million ETH. With a corresponding stock market capitalization of approximately $11.2–11.8 billion, BMNR’s calculated mNAV (market capitalization / on-chain asset net value) was approximately 1.27x, positioning it as the highest-valued among all publicly traded Digital Asset Treasury (DAT) companies.
BMNR’s strategic ascent is intimately linked to its organizational overhaul. Following his full assumption of capital operations in mid-2025, Chairman Tom Lee (co-founder of Fundstrat) championed the core thesis: “ETH is the institutional sovereign asset of the future.” Under his leadership, the company transitioned from a traditional mining enterprise to a structure with “ETH as its sole reserve asset and PoS yield as its core cash flow driver,” becoming the first U.S. company to fully pivot its primary business operations to an ETH-backed strategy.
In terms of financing, BMNR demonstrated remarkable intensity and efficiency. The company simultaneously expanded its funding sources through both public market and private channels, providing long-term capital for its Ethereum treasury strategy. This quarter, BMNR not only set a new pace for financing within traditional capital markets but also laid the institutional groundwork for “on-chain asset securitization.”
On July 9, BMNR, through a Form S-3 registration statement, entered into an “At-the-Market (ATM)” offering agreement with Cantor Fitzgerald and ThinkEquity, initially authorized for $2 billion. Just two weeks later, on July 24, the company disclosed in an SEC 8-K filing an increase in this authorization to $4.5 billion, responding to the positive market reception of its ETH treasury model. On August 12, BMNR submitted a further supplement to the SEC, elevating the total ATM authorization to $24.5 billion (adding an additional $20 billion) and explicitly stating the funds’ purpose for acquiring ETH and expanding its PoS staking asset portfolio.
It is important to note that these authorized amounts represent the maximum value of stock BMNR is approved by the SEC to issue continuously at market prices; they do not equate to actual cash raised.
Regarding actual capital deployment, the company executed several confirmed transactions:
- In early July 2025, a $250 million PIPE private placement was completed, providing initial capital for establishing ETH positions.
- ARK Invest (led by Cathie Wood) disclosed on July 22 the purchase of approximately $182 million in BMNR common stock, with $177 million of the net proceeds directly allocated by BMNR to increase its ETH holdings.
- Founders Fund (Peter Thiel) filed with the SEC on July 16, reporting a 9.1% stake. While not new financing, this move significantly bolstered institutional consensus in the market.
Furthermore, BMNR has cumulatively sold approximately $4.5 billion worth of stock under its earlier ATM authorizations, with actual capital raised substantially exceeding the initial PIPE amount. As of September 2025, the company had deployed billions of dollars through PIPE, ATM, and other channels, continuing its long-term expansion plans under the $24.5 billion total authorized framework.
BMNR’s financing architecture features a clear three-tiered structure:
- Confirmed Funding Layer: Completed PIPE and institutional private placements, totaling approximately $450–500 million.
- Market Expansion Layer: Phased stock sales via the ATM mechanism, with actual capital raised reaching billions of dollars.
- Potential Ammunition Layer: The SEC-approved total ATM authorization of $24.5 billion, providing significant flexibility for future ETH treasury expansion.
Leveraging this layered capital structure, BMNR rapidly built a reserve of approximately 3.03 million ETH (valued at about $12.58 billion), transforming its treasury strategy from a “single holding experiment” to institutionalized asset allocation.
BMNR’s valuation premium primarily stems from two layers of logic:
- Asset-Layer Premium: A consistent PoS staking yield, maintained at an annualized 3.4–3.8%, establishes a stable cash flow anchor.
- Capital-Layer Premium: As a “compliant ETH leverage channel,” BMNR’s stock price typically leads ETH spot prices by 3–5 trading days, making it a forward-looking indicator for institutions tracking the ETH market.
In terms of market behavior, BMNR’s stock price reached an all-time high in Q3, in tandem with ETH, and repeatedly instigated sector rotation. Its high turnover rate and rapid circulation of shares indicate that the DAT model is progressively evolving into a tradable “on-chain asset mapping mechanism” within the capital market.
SBET: A Transparency Blueprint for Institutional Treasuries
In contrast to BitMine Immersion Technologies (BMNR)’s aggressive balance sheet expansion, SharpLink Gaming (NASDAQ: SBET) adopted a more measured and institutionalized treasury path in Q3 2025. Its core competitive advantage lay not in the sheer volume of capital but in the transparent development of its governance structure, disclosure standards, and audit framework. This established a replicable “institutional-grade template” for the DAT industry.
As of September 2025, SBET held approximately 840,000 ETH. Based on the quarter-end average price, its on-chain assets were valued at roughly $3.27 billion, corresponding to a stock market capitalization of approximately $2.8 billion, resulting in an mNAV of approximately 0.95x. Despite its valuation being slightly below net asset value, the company’s quarterly EPS growth soared by 98%, demonstrating exceptional operational leverage and efficiency in ETH monetization and cost control.
SBET’s fundamental value proposition is rooted not in aggressive position expansion but in pioneering the DAT industry’s first compliant and auditable governance framework:
- Strategic advisor Joseph Lubin (Ethereum co-founder, ConsenSys founder) joined the company’s strategic committee in Q2, advocating for the integration of staking yields, DeFi derivatives, and liquidity mining strategies into the corporate treasury portfolio.
- Pantera Capital and Galaxy Digital participated in PIPE financing and held secondary market stakes, providing institutional liquidity and expert advisory on on-chain asset allocation.
- Ledger Prime furnished sophisticated on-chain risk hedging and volatility management models.
- Grant Thornton served as an independent auditor, tasked with verifying the authenticity of on-chain assets, yields, and staking accounts.
This comprehensive governance system represents the DAT industry’s inaugural “on-chain verifiable + traditional audit parallel” disclosure mechanism.
In its Q3 2025 10-Q report, SBET achieved a significant first by fully disclosing:
- The company’s primary wallet addresses and on-chain asset structure.
- Its staking yield curve and node distribution.
- Risk limits for collateralized and restaking positions.
This report positioned SBET as the first listed company to simultaneously disclose on-chain data within SEC filings, substantially enhancing institutional investor trust and financial comparability. The market widely regards SBET as a “compliant ETH index component stock”: its mNAV, close to 1x, maintains a high correlation with the ETH market, yet its transparency and robust risk structure contribute to relatively lower volatility.
The Dual Trajectories of ETH Treasury: Asset-Driven vs. Governance-Driven
The divergent paths taken by BMNR and SBET encapsulate the two core developmental arteries of the ETH DAT ecosystem in Q3 2025:
- BMNR: Asset-Driven – This model prioritizes balance sheet expansion through financing, institutional holdings, and capital premiums. BMNR rapidly accumulated ETH positions using PIPE and ATM financing tools, leveraging mNAV pricing to create a market-based leverage channel that directly coupled fiat capital with on-chain assets.
- SBET: Governance-Driven – This approach emphasizes transparency, compliance, structured treasury yields, and robust risk control. SBET integrated on-chain assets into a rigorous audit and information disclosure framework, establishing the institutional boundaries of DAT through a governance structure that harmonized on-chain verification with traditional accounting practices.
Together, these two models represent the extremes of ETH treasury’s evolution from a mere “reserve logic” to an “institutionalized asset form.” BMNR expanded capital scale and market depth, while SBET laid the foundation for governance trust and institutional compliance. In this transformative process, the functional attributes of ETH DAT have transcended simple “on-chain reserve assets,” evolving into a complex structure that integrates cash flow generation, liquidity pricing, and sophisticated balance sheet management.

PoS Yield, Governance Rights, and the Institutional Logic of Valuation Premium
The core competitive advantage of PoS crypto asset treasuries, such as those holding ETH, arises from a powerful triple combination: an interest-bearing asset structure, network-level influence, and sophisticated market valuation mechanisms.
High Staking Yield: Establishing a Cash Flow Anchor
Unlike Bitcoin’s “non-productive holdings,” ETH, as a Proof-of-Stake (PoS) network asset, can generate an annualized yield of 3–4% through staking. Furthermore, it can form complex composite yield structures within the DeFi market (Staking + Liquid Staking Tokens (LST) + Restaking). This empowers DAT companies to capture genuine on-chain cash flows in an enterprise format, transforming digital assets from “static reserves” into “yield-bearing assets” characterized by stable, intrinsic cash flow generation.
Influence and Resource Scarcity Under PoS Mechanisms
As ETH treasury companies expand their staking operations, they gain significant network-level governance rights and sequencing priority. BMNR and SBET, for instance, collectively control approximately 3.5–4% of the total staked ETH across the network, placing them within the marginal influence zone of protocol governance. This level of control carries a premium logic akin to “systemic importance,” prompting the market to assign a valuation multiplier higher than the net asset value of their holdings.
The Mechanism of mNAV Premium Formation
The valuation of DAT companies not only reflects the net asset value (NAV) of their underlying on-chain assets but also incorporates two distinct types of expectations:
- Cash Flow Premium: The anticipated distributable profits derived from staking yields and other on-chain strategies.
- Structural Premium: The corporate equity provides traditional institutions with a compliant avenue for ETH exposure, thereby creating institutional scarcity and demand.
During the market peaks of July–August, the average ETH DAT mNAV consistently hovered in the 1.2–1.3x range, with some individual companies, like BMNR, briefly touching 1.5x. This valuation logic parallels the premiums observed in gold ETFs or the NAV premium/discount structures of closed-end funds, serving as a critical “pricing intermediary” for institutional capital entering on-chain assets.
In essence, the DAT premium is not merely emotion-driven; it is forged from a composite structure of verifiable yields, network power, and accessible capital channels. This fundamental strength explains why ETH treasuries achieved a higher capital density and trading activity compared to Bitcoin treasuries (the MSTR model) in a remarkably short period of just one quarter.
Structural Evolution: From ETH to Multi-Altcoin Treasuries
As August and September unfolded, the expansion of non-Ethereum Digital Asset Treasuries (DATs) accelerated significantly. This new wave of institutional allocation, epitomized by Solana-based treasuries, signaled a thematic shift in the market from “single-asset reserve” to “multi-chain asset layering.” This trend indicates that the DAT model is being replicated from its ETH core across diverse ecosystems, forging a more systematic, cross-chain capital structure.
FORD: The Institutional Blueprint for Solana Treasury
Forward Industries (NASDAQ: FORD) emerged as the most prominent case study in this phase. The company successfully completed a $1.65 billion PIPE financing in Q3, with all proceeds dedicated to establishing Solana spot positions and investing in ecosystem collaborations. As of September 2025, FORD held approximately 6.82 million SOL. Valued at the quarter-end average price of $248–$252, its on-chain treasury net value stood at approximately $1.69 billion, corresponding to a stock market capitalization of about $2.09 billion. This resulted in an mNAV of approximately 1.24x, positioning FORD as the leading non-ETH treasury enterprise.
Unlike earlier ETH DATs, FORD’s ascent was not driven by a singular asset but by the synergistic resonance of multiple capital sources and ecosystem players:
- Its investor base included Multicoin Capital, Galaxy Digital, and Jump Crypto—all long-term, core investment institutions within the Solana ecosystem.
- The governance structure incorporated advisory board members from the Solana Foundation, establishing a strategic framework where “on-chain assets are integral corporate production materials.”
- The held SOL assets remain fully liquid, deliberately not staked or allocated to DeFi protocols, to preserve strategic flexibility for future restaking and Real-World Asset (RWA) integrations.
This “high liquidity + configurable treasury” model has established FORD as a central capital hub for the Solana ecosystem, reflecting the market’s expectation of a structural premium for high-performance public chain assets.
Structural Shifts in the Global DAT Landscape
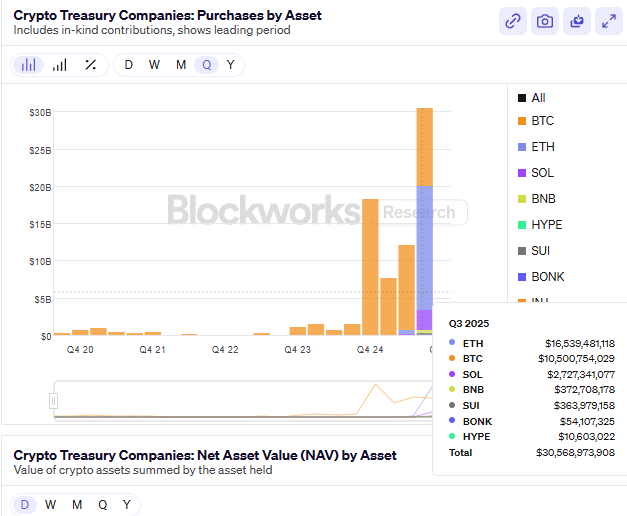
By the end of Q3 2025, the total publicly disclosed non-Bitcoin DAT treasury size globally had surpassed $24 billion, representing approximately 65% growth quarter-over-quarter from Q2. The structural distribution was as follows:
- Ethereum (ETH) maintained its dominant position, accounting for approximately 52% of the total.
- Solana (SOL) captured roughly 25%, solidifying its status as the second-largest institutional allocation.
- The remaining capital was primarily distributed among emerging assets such as BNB, SUI, and HYPE, forming the horizontal expansion layer of the DAT model.
The valuation anchor for ETH DAT lies in PoS returns and governance rights value, representing a combined logic of long-term cash flow and network control. In contrast, SOL DAT derives its core premium from ecosystem growth potential and staking efficiency, emphasizing capital efficiency and scalability. While BMNR and SBET established the institutional and asset foundations during the ETH phase, FORD’s emergence propelled the DAT model into its second stage of multi-chain and ecological development.
Concurrently, some new entrants began exploring functional extensions of DAT:
- Ethena (ENA) introduced the StablecoinX model, which integrates Treasury bond yields with on-chain hedging structures. This initiative aims to construct “yield-bearing stablecoin treasuries,” creating stable yet cash-flow-generating reserve assets.
- BNB DAT, predominantly driven by the exchange ecosystem, expands liquidity pools by leveraging asset collateralization and reserve tokenization by ecosystem enterprises, forming a “closed treasury system.”
Temporary Stagnation and Risk Repricing Post-Valuation Overextension
Following a concentrated rally in July–August, the DAT sector entered a rebalancing phase in September, grappling with valuation overextension. Second-tier treasury stocks had briefly inflated the overall sector premium, pushing the median mNAV above 1.2x. However, as regulatory scrutiny intensified and financing slowed, valuation support rapidly receded by quarter-end, leading to a noticeable cooling of sector enthusiasm.
Structurally, the DAT industry is transitioning from “asset innovation” to “institutional integration.” While ETH and SOL treasuries established a “dual-core valuation system,” the liquidity, compliance, and genuine yield of these expanding assets remain in a validation phase. In essence, the market’s primary driver has shifted from “premium expectation” to “yield realization,” ushering the industry into a repricing cycle.
Entering September, core indicators simultaneously weakened:
- ETH staking yield declined from 3.8% at the quarter’s start to 3.1%, while SOL staking yield saw a quarterly reduction exceeding 25%.
- The mNAV of several second-tier DAT companies fell below 1, indicating diminishing marginal capital efficiency.
- Total PIPE and ATM financing volume decreased by approximately 40% month-over-month, with institutions like ARK, VanEck, and Pantera pausing new DAT allocations.
- At the ETF level, net fund inflows turned negative, as some funds reallocated ETH treasury positions to short-duration government bond ETFs to mitigate valuation volatility risk.
This market correction exposed a critical issue: the short-term overextension of the DAT model’s capital efficiency. Early valuation premiums were driven by structural innovation and institutional scarcity. However, as on-chain yields declined and financing costs rose, corporate balance sheet expansion outpaced yield growth, leading to a “negative dilution cycle”—where market capitalization growth became reliant on financing rather than sustainable cash flow.
From a macroeconomic perspective, the DAT sector is now entering a period of “valuation internalization”:
- Core companies (BMNR, SBET, FORD) are maintaining structural stability by relying on robust treasuries and transparent information.
- Marginal projects, due to their singular capital structures and insufficient disclosure, are facing deleveraging pressures and liquidity contraction.
- On the regulatory front, the SEC’s demands for companies to publicly disclose primary wallet addresses and staking yield standards are further compressing the scope for “high-frequency balance sheet expansion.”
Short-term risks primarily stem from valuation compression caused by liquidity reflexivity. Should mNAV continue its downward trend and PoS yields struggle to cover financing costs, confidence in the “on-chain reserve + equity valuation” model will erode, potentially leading to a systemic valuation pullback reminiscent of the post-DeFi Summer of 2021. Nevertheless, the DAT industry is not in decline but rather transitioning from an “expansion-driven” to a “yield-driven” stage. In the coming quarters, ETH and SOL treasuries are expected to retain their institutional advantages, with their core valuation increasingly dependent on:
- The efficiency of staking and restaking yields.
- On-chain transparency and compliant disclosure standards.
In essence, the initial phase of the DAT craze has concluded, and the industry is now in a “consolidation and validation period.” Future valuation recovery will critically depend on the stability of PoS yields, the integration efficiency of restaking, and the clarity of regulatory policies.
Prediction Markets: Macro Narrative’s Barometer and the Rise of the Attention Economy
In Q3 2025, prediction markets evolved from a “crypto-native niche” into a sophisticated “new market infrastructure at the confluence of on-chain and compliant finance.” Amidst frequent macroeconomic policy shifts and intense fluctuations in inflation and interest rate expectations, prediction markets increasingly became crucial venues for gauging market sentiment, hedging against policy risks, and discovering narrative-driven prices. The integration of macro and on-chain narratives transformed them from mere speculative tools into a market layer capable of both information aggregation and price signaling.
Historically, crypto-native prediction markets have demonstrated remarkable foresight during numerous macroeconomic and political events. For instance, during the 2024 U.S. presidential election, Polymarket’s total trading volume exceeded $500 million, with the “Who will win the presidential election” contract alone accounting for $250 million. Its single-day peak trading volume surpassed $20 million, setting an on-chain prediction market record. In macroeconomic events such as “Will the Federal Reserve cut interest rates at the September 2024 FOMC meeting,” contract price movements consistently preceded expected adjustments in CME FedWatch interest rate futures, indicating their value as a leading indicator during specific periods.
Despite this impressive growth, the overall size of on-chain prediction markets remains considerably smaller than their traditional counterparts. Since 2025, global crypto prediction markets (typified by Polymarket and Kalshi) have accumulated approximately $24.1 billion in trading volume. In contrast, traditional regulated platforms like Betfair and Flutter Entertainment record annual trading volumes in the hundreds of billions of dollars. While on-chain market size is still less than 5% of traditional markets, they exhibit higher growth rates than traditional financial products in user adoption, thematic coverage, and trading activity.
During Q3, Polymarket emerged as a phenomenal growth story. Contrary to mid-year rumors of a $1 billion valuation financing, early October reports indicated that ICE, the parent company of the NYSE, planned to invest up to $2 billion for approximately a 20% stake, valuing Polymarket at an estimated $8–9 billion. This signifies a clear validation of its data and business model by Wall Street. By the end of October, Polymarket’s annual cumulative trading volume reached approximately $13.2 billion. Its September monthly trading volume hit $1.4–1.5 billion—a substantial increase from Q2—and October’s monthly volume soared to a new historical high of $3 billion. Trading themes predominantly revolved around macro and regulatory events, including “Will the Federal Reserve cut rates at the September FOMC meeting,” “Will the SEC approve an Ethereum ETF before year-end,” “U.S. presidential election key state win probabilities,” and “Circle (CIR) stock performance post-listing.” Researchers have noted that the price fluctuations of these contracts often led U.S. Treasury yields and FedWatch probability curves by approximately 12–24 hours, establishing them as forward-looking indicators of market sentiment.
Concurrently, Kalshi achieved institutional breakthroughs on its compliance trajectory. As a prediction market exchange registered with the U.S. Commodity Futures Trading Commission (CFTC), Kalshi completed a $185 million Series C financing in June 2025 (led by Paradigm), valuing it at approximately $2 billion. By October, its disclosed valuation had surged to $5 billion, with annualized trading volume growth exceeding 200%. In Q3, the platform introduced contracts related to crypto assets, such as “Will Bitcoin close above $80,000 by month-end” and “Will an Ethereum ETF be approved before year-end.” This marked the formal entry of traditional institutions into the speculative and hedging market for “crypto-narrative events.” According to Investopedia, its crypto-related contracts generated over $500 million in trading volume within two months of launch, providing institutional investors with a new, compliant avenue to express macroeconomic expectations. This development has fostered a dual-track landscape for prediction markets: “on-chain freedom + compliant rigor.”
Unlike earlier prediction platforms that often leaned towards entertainment and political topics, the mainstream market focus in Q3 2025 shifted significantly towards macroeconomic policy, financial regulation, and crypto-equity linkage events. Macro and regulatory contracts on the Polymarket platform accumulated over $500 million in trading volume, accounting for more than 40% of the quarter’s total. Investors maintained high engagement in themes such as “Will an ETH spot ETF be approved before Q4” and “Will Circle’s stock price break key levels after listing.” The price movements of these contracts, at times, even preceded traditional media sentiment and derivatives market expectations, gradually evolving into a “market consensus pricing mechanism.”

The core innovation of on-chain prediction markets lies in their ability to achieve liquid event pricing through tokenization mechanisms. Each prediction event is tokenized for binary or continuous pricing (e.g., YES/NO Tokens) and maintains liquidity via Automated Market Makers (AMM), enabling efficient price discovery without the need for traditional order books. Settlement relies on decentralized oracles (e.g., UMA, Chainlink) executing on-chain, ensuring transparency and auditability. This structure allows virtually all social and financial events—from election outcomes to interest rate decisions—to be quantified and traded as on-chain assets, establishing a new paradigm of “information financialization.”
However, this rapid development is not without its risks. Firstly, oracle risk remains a fundamental technical bottleneck for on-chain prediction markets; any external data delay or manipulation could trigger contract settlement disputes. Secondly, undefined compliance boundaries continue to constrain market expansion, with regulatory stances on event-based derivatives not yet fully harmonized across the U.S. and E.U. Thirdly, some platforms still lack robust Know Your Customer (KYC) and Anti-Money Laundering (AML) processes, potentially exposing them to fund source compliance risks. Finally, liquidity is excessively concentrated on leading platforms (Polymarket commands over 90% market share), which could lead to price deviations and amplified market volatility during extreme market conditions.
Overall, the Q3 performance of prediction markets demonstrates their evolution from a marginalized “crypto novelty” to a crucial layer for macro narratives. They serve as both an immediate reflection of market sentiment and an intermediary tool for information aggregation and risk pricing. Looking ahead to Q4, prediction markets are poised to continue their evolution along a “on-chain × compliant” dual-cycle structure: the on-chain segment, led by Polymarket, will expand by leveraging DeFi liquidity and macro narrative trading, while the compliant path, exemplified by Kalshi, will accelerate institutional capital attraction through regulatory recognition and USD-denominated mechanisms. As data-driven financial narratives become more pervasive, prediction markets are transitioning from an attention economy to a foundational decision-making infrastructure, becoming a rare and valuable new asset layer within the financial system that can both reflect collective sentiment and offer forward-looking pricing capabilities.
References
https://www.strategicethreserve.xyz/
https://blockworks.com/analytics/treasury-companies
https://www.theblock.co/data/decentralized-finance/prediction-markets-and-betting
(The above content is excerpted and reprinted with authorization from partner PANews, original link | Source: ArkStream Capital)
Disclaimer: This article is for market information purposes only. All content and opinions are for reference only and do not constitute investment advice. They do not represent the views and positions of BlockBeats. Investors should make their own decisions and trades. The author and BlockBeats will not bear any responsibility for direct or indirect losses incurred by investors’ transactions.