
Author: 0xBrooker
Bitcoin’s Crossroads: Navigating Macro De-risking Amidst On-Chain Shifts
The past week proved to be a pivotal “de-risking” period for global financial markets. A cascade of significant economic data releases, key interest rate decisions, and derivatives expiry dates collectively helped to alleviate short-term risks for the U.S. stock market.
Meanwhile, Bitcoin (BTC) remains entrenched in a deleveraging and repricing phase, having experienced a 30%+ retracement from its projected October 2025 high of $126,000. The digital asset’s price has been persistently testing the $85,000-$90,000 range, yet a definitive trend reversal signal has not materialized.
Beneath the surface, market participant dynamics reveal a complex interplay: long-term holders continue to reduce their positions, and retail investors are steadily withdrawing capital. Conversely, sophisticated traders (DATs) and large institutional players (“whale sharks”) are actively accumulating. While the battle for dominance is ongoing, the overall selling pressure appears to be subsiding. With a degree of macroeconomic liquidity easing, trading enthusiasm shows signs of recovery. Over the coming weeks, BTC is anticipated to re-challenge the $94,000 mark.
Policy, Macro-Financial, and Economic Data Highlights
The global financial landscape was shaped by critical data, interest rate events, and derivatives expiries, collectively reinforcing the consensus of a “soft landing path” for the U.S. economy—characterized by moderate employment slowdown and gradual inflation deceleration. U.S. equities saw a week of initial dips followed by a strong rebound, suggesting the market has fully priced in recent events and thereby defused immediate risks. BTC mirrored this movement, closing the week with a modest gain of 0.53%.
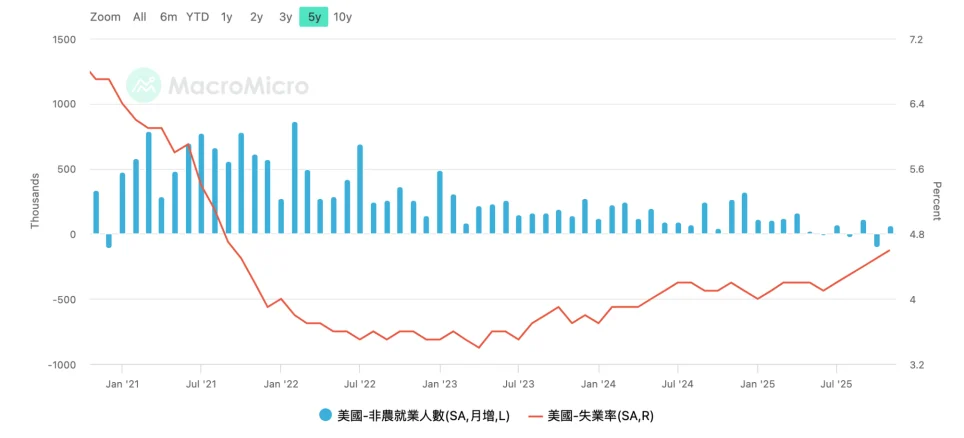
On December 16th, the U.S. Department of Labor released non-farm payroll data for October and November. October saw a decline of 105,000 non-farm jobs, while November rebounded from its low to add 64,000 jobs, though still indicating weakness. The unemployment rate for November rose to 4.6%, marking its highest point since 2022.
December 18th brought the release of November’s CPI data from the U.S. Bureau of Labor Statistics. The Consumer Price Index (CPI) showed an annual increase of 2.7%, significantly lower than the expected 3.1%. Core CPI also came in notably below expectations at 2.6% annually, against a projected 3%. However, several institutions cautioned that this data might be subject to statistical distortion due to government shutdowns and insufficient data collection. Its repeatability will require verification with subsequent December data. Federal Reserve “number three” John Williams reiterated this point in a Friday speech, implying that a January rate cut remains a low-probability event.
Despite the unemployment rate hitting a multi-year high and the CPI data showing a substantial, albeit potentially distorted, drop, the market largely maintains its conviction. The prevailing view is that the Federal Reserve is still likely to implement two rate cuts totaling 50 basis points in 2026.
On December 19th, the Bank of Japan (BoJ) unanimously voted to raise its policy interest rate by 25 basis points, moving from 0.50% to 0.75%—the highest in 30 years. During the press conference, BoJ Governor Kazuo Ueda emphasized that future adjustments would be data-dependent. He also noted that the current rate remains below the estimated neutral range and that real interest rates are still negative.
Given that this rate hike was largely priced into the market, and the BoJ’s statements were perceived as “dovish,” the USD/JPY pair rebounded consistently after its Tuesday low, once again approaching its year-to-date high. This significantly reduced market expectations for a major “Carry Trade” shock that could have resulted from yen strengthening and dollar weakening. Consequently, various markets reverted to their original logical trajectories.
Influenced by the settled yen rate hike, Friday’s “Triple Witching Day” in the U.S. market—a simultaneous expiry of stock index options, stock index futures, and individual stock options with a notional value of $7.1 trillion—unfolded smoothly. The three major U.S. stock indices continued their ascent, closing at their highest points.
While concerns about AI spending and profitability persist, the stabilization of U.S. inflation and employment data, coupled with the BoJ’s rate hike, has allowed the market to temporarily navigate past a turbulent zone. Though BTC still hovers at a low point in its rebound, it has momentarily averted the $80,000 floor that macroeconomic financial risks and liquidity shortages had threatened, positioning it for a potential recovery.
Traders are now eagerly anticipating a “Christmas rally” and awaiting further market guidance once January’s data becomes available and more reliable.
Cryptocurrency Market Dynamics
As a leading indicator of global macroeconomic liquidity, BTC has been trending downwards since October. This downward pressure stems from two primary factors: a sell-off of high-beta assets and deleveraging amidst tightening liquidity, and a “cyclical” tendency driving long-term holders to reduce their positions.
On-chain data reveals that the “long-hand” cohort continues its selling activity. Last week, nearly 90,000 BTC were activated into short-term holdings, with 12,686 BTC directly moving to exchanges for sale. The combined selling from both long-term and short-term holders reached 174,100 BTC last week. While this figure is slightly lower than the preceding week, it still represents a significantly elevated level of selling pressure.
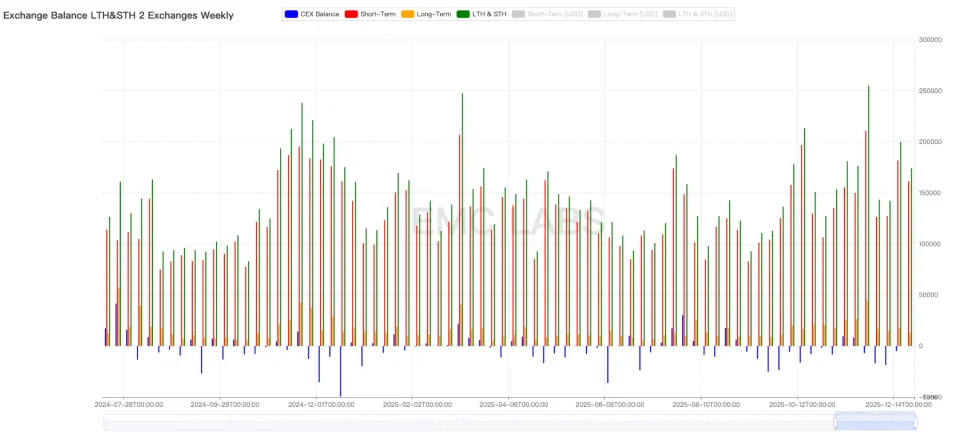
Paradoxically, exchanges reversed their outflow trend, showing a slight accumulation last week, which typically signals bearish sentiment. However, the 30-day rolling average of exchange selling volume is declining, suggesting that the most intense phase of short-term selling might be abating.
Despite increased selling, capital continues to flow out of the market.
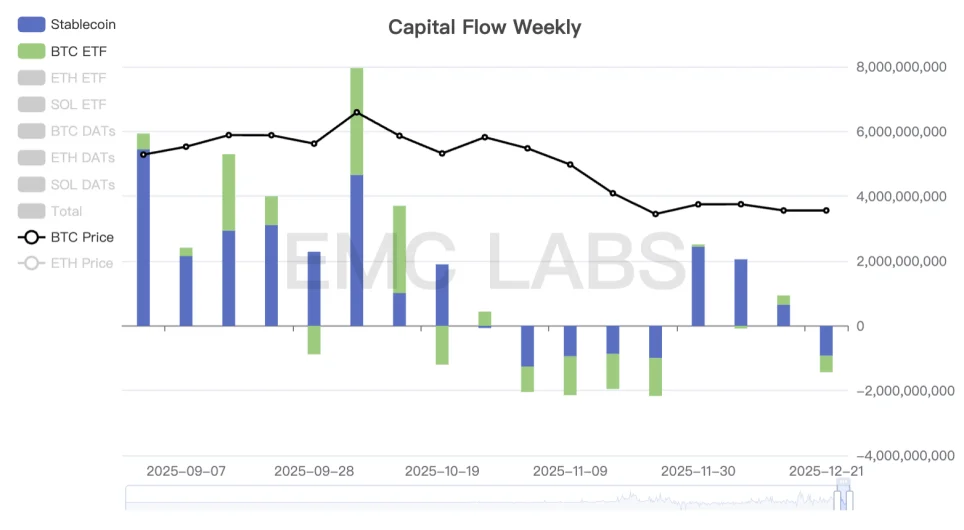
Since bottoming out on November 21st, capital flows had gradually turned positive. However, last week saw a shift back to outflows, occurring simultaneously through both stablecoin and ETF channels. This is a fundamental reason for BTC’s secondary price dip and its anemic rebound, indicating that while selling hasn’t significantly diminished, buying power is notably absent. With macroeconomic risks temporarily resolved, the crucial question for the coming week is whether this buying power will return.
From an on-chain supply perspective, currently, 67% of BTC remains in profit, while 33% of the supply is held at a loss. This represents the lowest proportion of profitable supply since the current bull market’s ascending phase.
Across both on-chain and ETF channels, retail investors are still exiting the market. The primary buying power is observed from DATs (Day Aggregate Traders) and “whale shark” groups. These cohorts, known for their higher success rates in counter-trend trading, are consistently maintaining their accumulation strategies. Their track record of high win rates over the past two years of the bull market positions them as key forces shaping current market dynamics.
Last week’s initial de-risking from CPI, inflation, and the yen rate hike has set the stage. This week, whether capital returns to the ETF channels or continues to flow out will likely dictate BTC’s short-term trajectory. The medium-term outlook—whether BTC can sustain a rebound to re-challenge $94,000, or even reclaim the short-term investor cost basis of $103,000, or if it will revisit lower lows and definitively enter a bear market—remains contingent on the ongoing tug-of-war among various trading cohorts.
Cycle Indicators
According to the eMerge Engine, the EMC BTC Cycle Metrics indicator currently stands at 0, signaling an entry into a “downturn period” (bear market).
(The above content is an excerpt and reproduction authorized by partner PANews. Original Link | Source: EMC Labs)
Disclaimer: This article is for market information purposes only. All content and opinions are for reference only and do not constitute investment advice. They do not represent the views or positions of BlockTempo. Investors should make their own decisions and trades. The author and BlockTempo will not be liable for any direct or indirect losses incurred by investors as a result of their trading.