

Author: Bull Theory
Translated & Edited by: Yuliya, PANews
The Silent Peak: Why Bitcoin’s 4-Year Cycle Endures, Despite the Failure of Traditional Indicators
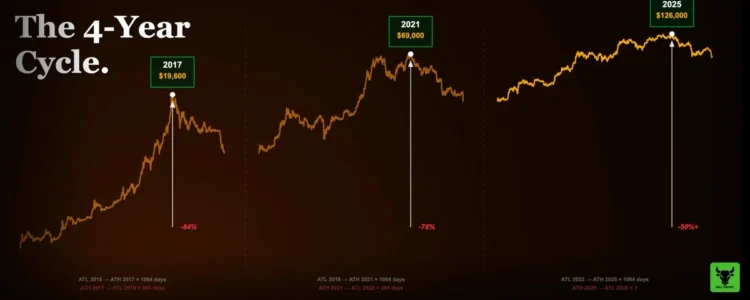
The cryptocurrency market witnessed its most predictable crash yet, one that seemingly caught everyone off guard. The prevailing narrative at the peak of the 2025 bull run was clear: “The 4-year cycle is dead. Institutional involvement has changed everything. Old rules no longer apply.” Yet, Bitcoin topped almost exactly on schedule, plunged 50%, and is now precisely where the cyclical framework predicted it would be. It’s time for an honest conversation about what truly transpired.
The 4-Year Cycle Isn’t Dead; The Buyers Have Just Changed
Throughout 2024 and early 2025, the crypto space was awash with a compelling narrative: Bitcoin ETFs had revolutionized everything. Institutions were buying, rendering the traditional 4-year cycle—driven by halving events and retail FOMO—obsolete. This was heralded as a “supercycle,” where bear markets were a relic of the past.
The reasoning was persuasive. Bitcoin hit a new all-time high *before* the halving, an unprecedented event. ETF inflows shattered records. Michael Saylor’s MicroStrategy acquired billions in Bitcoin weekly. Mainstream financial media, for the first time, covered Bitcoin as a legitimate asset class. The overall sentiment suggested that the old rules had indeed vanished.
However, on October 6, 2025, Bitcoin peaked at $126,296, subsequently plummeting by approximately 50% from its high. The Fear & Greed Index now signals extreme fear, and a death cross has appeared on the charts. The cycle, presumed dead, played out with the same precision as in 2013, 2017, and 2021.
The 4-year cycle never died; it merely became more covert. The reason for its hidden nature—why no one anticipated the top and why no traditional top indicator sounded an alarm—is crucial for understanding our current position and future trajectory.
Before delving deeper, it’s vital to grasp what the cycle fundamentally is and why it has persisted for over a decade. Those who dismissed the cycle weren’t entirely wrong; the market *did* change. But instead of breaking the cycle, the cycle adapted with the market.
Every four years, a halving event cuts the supply of newly minted Bitcoin by 50%. Miners, the largest and most consistent sellers of Bitcoin, extract coins and sell them to cover operational costs. When the halving halves their output, the daily supply entering the market drastically shrinks. If demand remains constant or increases, the price is fundamentally compelled to rise. This isn’t theory; it’s a basic supply-demand mechanism underpinning Bitcoin’s price movements.
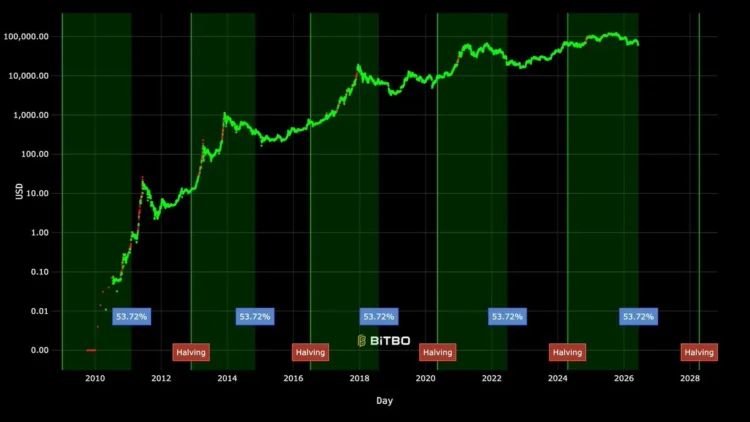
Reviewing every halving since 2012 reveals an undeniable, repeating pattern in Bitcoin’s bull and bear market transitions.
Four cycles, four halvings. The fundamental structure has been identical each time. This is precisely what those who declared the cycle dead overlooked: the cycle doesn’t care about narratives. It operates on a supply-demand mechanism that doesn’t change simply because institutions begin buying via ETFs. The April 2024 halving occurred as scheduled. Bitcoin topped 535 days later, on October 6, 2025. This falls perfectly within the historical window of 480 to 550 days post-halving for previous cycle tops.
The cycle never died. It only *appeared* different because the buyers had changed. And this difference – institutional demand replacing retail demand – is why no top indicators were triggered, and why most who relied on them completely missed the peak.
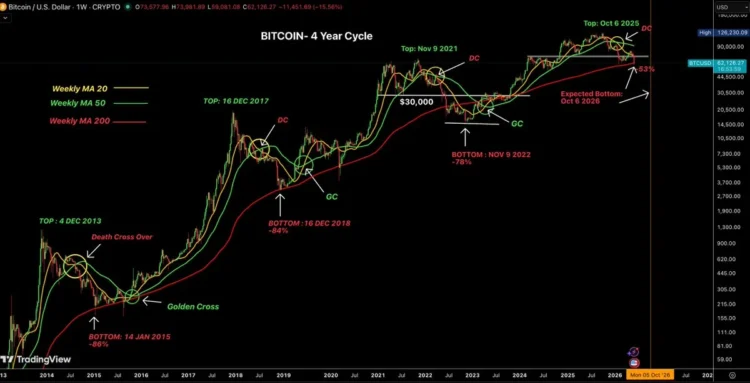
Tracking the four Bitcoin cycles, noting tops, bottoms, death crosses, golden crosses, and the 200-week moving average.
Another consistent pattern within these cycles, often overlooked, is that bottoms consistently arrive approximately one year after the peak. While not precisely 365 days, the range is remarkably tight. After the 2013 peak, the bottom arrived 410 days later. After 2017, it was 363 days. After 2021, 376 days. If this rhythm holds, the current cycle’s bottom is projected to fall between late September and mid-November 2026.
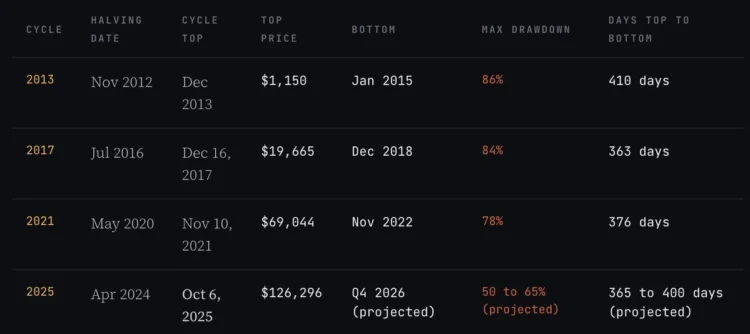
The decline percentages also reveal a clear trend: 86%, 84%, 78%, and now potentially 50% to 65%. Each bear market has been shallower than the last. This isn’t accidental; it reflects a maturing asset. Bitcoin now boasts institutional buyers who don’t panic sell, a regulated ETF market creating structural demand, and corporations holding Bitcoin as a treasury reserve on their balance sheets. As the buyer demographic matures, volatility is compressed.
This cycle also witnessed an unprecedented event: Bitcoin hit a new all-time high *before* the halving. In March 2024, a full month before the April 20 halving, Bitcoin reached $73,581, surpassing its 2021 high of $69,000. This was a new ATH, but not the cycle top. Every previous cycle eventually topped several months *after* the halving, and this time was no exception—the true cycle top occurred on October 6, 2025, at $126,296, well after the April 2024 halving. The distinction was the pre-halving ATH, which had never happened before. The reason? The approval of spot Bitcoin ETFs in January 2024, which pulled institutional demand into the market *before* the halving, front-loading the cycle and confusing many who tracked the usual post-halving timelines.
What Happened to Retail Investors This Cycle?
To understand why Bitcoin topped without any familiar signals, one must comprehend what happened to retail capital in the 18 months leading up to the peak. In short: most retail capital was depleted long before Bitcoin reached $126,000.
In previous Bitcoin bull markets, retail investors played a specific role. They provided the final fuel, creating the last frenzy and parabolic surge. It was retail FOMO that pushed Bitcoin from a reasonable price to extreme valuations in the final stages of each cycle. This is also why top indicators were triggered—these tools were specifically designed to measure retail behavior, not institutional behavior. Without retail frenzy, there are no indicator triggers.
In this cycle, retail investors never appeared in Bitcoin in significant numbers. This isn’t because they weren’t involved in crypto; they were, but they were “fleeced” elsewhere first.
The Memecoin Liquidity Trap
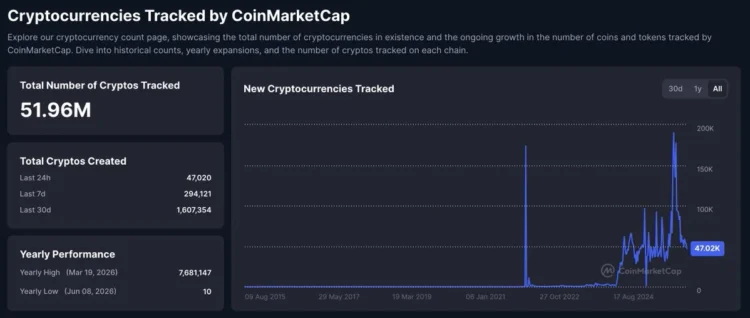
The biggest factor destroying retail liquidity this cycle was the extreme ease of creating and launching memecoins. Token launch platforms (especially on Solana) allowed anyone to issue a token in minutes with virtually zero cost. By mid-2025, the total number of tokens had surged from approximately 10,000-20,000 at the 2021 peak to over 10 million.
Consider what this meant for a retail investor trying to navigate the market. In 2021, you had roughly 200 tokens worth serious consideration—real projects with users, revenue, or at least a solid team and product roadmap. The path from “I want to invest in crypto” to “I bought ETH and SOL” was short and clear. That’s where retail capital concentrated, which is why ETH reached $4,800 and SOL hit $260.
But in 2025, you had 10 million options. The vast majority of these tokens were designed with one purpose: to extract capital from retail buyers as quickly as possible and transfer it to insiders. The method was simple: create a token, artificially generate hype, sell when retail buys, then cash out. This practice was repeated thousands of times daily across the ecosystem.
While 2021 retail investors faced a manageable number of options, mostly legitimate projects, 2025 retail investors faced millions of options, the vast majority structured to harvest their funds. The outcome was predictable: retail capital entered the crypto market in 2025, but most of it never flowed into Bitcoin or quality altcoins; it was first siphoned off by memecoin syndicates.
The involvement of influential public figures further amplified this problem. Numerous high-profile individuals from politics, entertainment, and social media launched their own memecoins this cycle. The pattern was always the same: a celebrity-backed token launched with immense hype, prices surged as retail bought in hoping to capitalize on the name, and insiders/early holders sold into the rally. The token would then crash 80-95% within days or weeks. Retail was left holding worthless tokens, valued at a fraction of their purchase price.
This scenario played out repeatedly throughout 2024 and 2025. Each instance permanently erased a significant chunk of retail liquidity from the ecosystem. Those who lost money in these projects didn’t then turn around and buy Bitcoin; they either exited the market entirely or had no capital left to invest.
High FDV & Low Circulating Supply in VC Tokens
The second major factor destroying retail capital was the structure of new token launches this cycle. This is less discussed but equally devastating.
In 2021, new crypto projects typically launched with a Fully Diluted Valuation (FDV) of $100 million to $1 billion. This left genuine upside for public market buyers. A project launching at $200 million FDV and growing to $2 billion could yield a 10x return for retail investors. This is the memory of 2021—the “I bought this token early and turned $5,000 into $50,000” stories.
This cycle, the structure completely changed. Venture Capital funds raised billions in 2021 and 2022 to invest in crypto infrastructure. By 2024 and 2025, their portfolio companies were ready to launch tokens, and VCs needed to show returns to their Limited Partners (LPs). Consequently, projects began launching at FDVs of $5 billion, $10 billion, or even $20 billion, with only 5% to 15% of the supply actually circulating on day one.
What this meant in reality: retail saw a token trading at a seemingly $500 million market cap and believed there was room to grow. But the true FDV at that price was $10 billion, with 85% of tokens sitting in VC wallets, waiting to unlock over the next two to four years. Every month, more tokens unlocked and were sold. The price faced a structural ceiling because the supply pressure never ceased. Retail buyers were essentially buying into a continuous sell-off they weren’t aware of.
An independent study tracking 118 tokens launched in 2025 found that 84.7% traded below their launch valuation, with a median price drop of 71%. These weren’t obscure projects; many were listed on major exchanges with massive marketing budgets and media exposure. Yet, they still lost most of their value because their tokenomics were inherently structured to benefit insiders at the expense of public buyers.
The combined effect of memecoins and high-FDV VC project launches was the massive destruction of retail crypto capital *before* Bitcoin even approached its cycle peak. By October 2025, most retail participants who entered the market in 2024 had either lost significant capital or exited entirely. There was no remaining liquidity to rotate into Bitcoin. There was no FOMO wave. The fuel that historically drove the final parabolic top was absent.
Where Was Retail Capital Supposed to Go?
The 2021 cycle worked because retail capital had a clear path: Buy Bitcoin → Bitcoin pumps → Rotate to large-cap altcoins → Large-caps pump → Rotate to mid-cap altcoins → Mid-caps pump → Rotate to small-caps. Capital cascaded down a predictable market cap chain, generating returns at each layer.
But in 2025, this cascade never began. Large-scale retail buying of Bitcoin never materialized; their capital was already exhausted. Bitcoin’s market cap dominance remained above 60% for almost the entire bull run. The Altcoin Season Index peaked at 78% for approximately three weeks in September 2025 before immediately crashing. There was only a brief window where altcoins outperformed Bitcoin, after which Bitcoin’s dominance quickly returned above 60%.
The anticipated altcoin season didn’t arrive, not because the market was wrong, but because the mechanism that creates altcoin season—retail capital rotating down the market cap chain—had failed. The capital had already been drained.
How Institutions Changed the Cycle’s Structure
While retail investors were losing money to memecoins and VC token launches, something entirely new was happening with Bitcoin. For the first time in the asset’s history, regulated institutional products were pouring billions of dollars into Bitcoin on a structured, sustained timetable.
The approval of spot Bitcoin ETFs in January 2024 was more than just a headline. It fundamentally altered Bitcoin’s marginal buyer demographic, and this shift created a cascade of effects that made everything about this cycle different.
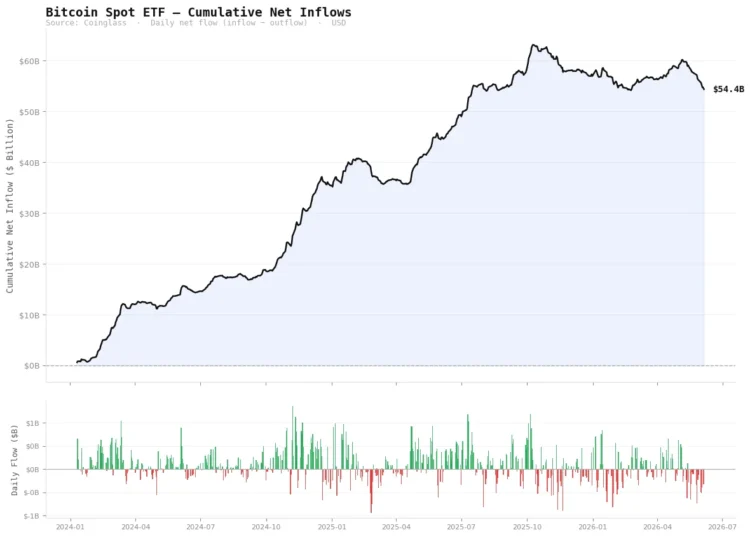
Bitcoin spot ETF cumulative net inflows peaked at $63.1 billion in October 2025, currently standing at $54.4 billion (Source: Coinglass).
From January 2024 to October 2025, spot Bitcoin ETFs accumulated $63 billion in net inflows. At its peak, daily inflows exceeded $350 million, 8 to 9 times the value of new Bitcoin produced by miners each day. On the largest single day, over $1 billion flowed in within a single trading session.
These were not retail investors. These were pension funds, Registered Investment Advisors (RIAs), family offices, endowments, and hedge funds making asset allocation decisions on a quarterly rhythm. They weren’t checking Bitcoin’s price in the middle of the night. They weren’t FOMOing into a green candle on X (Twitter). They received an asset allocation mandate and systematically executed it over weeks and months.
When this type of buyer becomes the dominant force in the market, price action looks completely different from a retail-dominated market. You no longer see long consolidations followed by explosive vertical pumps; instead, there’s a slow, sustained upward climb. No more parabolic weekly candles, but a steady, unexciting uptrend that accumulates massive gains over time.
Bitcoin surged from $40,000 in January 2024 to $126,000 in October 2025, a 215% increase. In any previous cycle, a move of this magnitude would have included several weeks of 30-40% single-week gains. In this cycle, weekly gains were remarkably subdued by historical standards. The overall gain was immense, but it arrived in a methodical, almost boring fashion, rather than explosively.
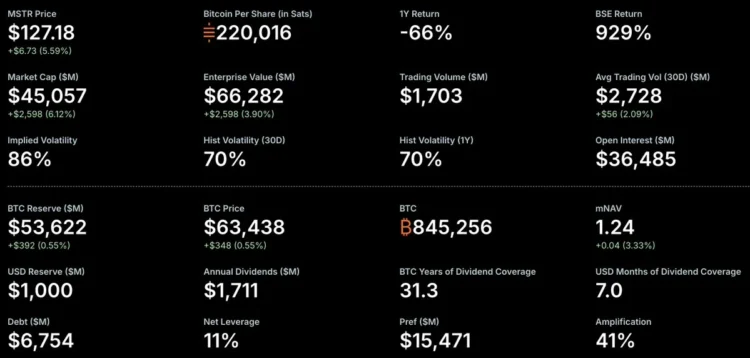
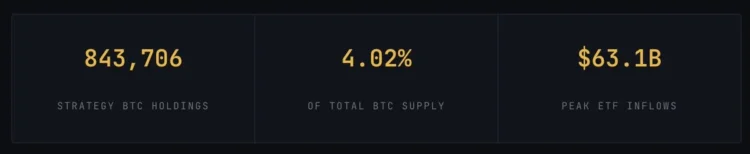
MicroStrategy holds 845,256 BTC, accounting for 4.02% of Bitcoin’s total supply, accumulated through continuous corporate capital purchases.
Then there’s MicroStrategy. Their model defined the most extreme version of institutional buying this cycle. They transformed their entire corporate treasury strategy into a Bitcoin accumulation machine, raising capital through equity and preferred stock offerings and deploying it directly into Bitcoin purchases. As of June 2026, they held 843,706 Bitcoins, representing 4.02% of the total future supply.
In 2025 alone, they raised $25.3 billion through capital markets to buy Bitcoin. They don’t sell, nor do they hedge. They accumulate consistently, week after week, regardless of price. This was a structural buying force that simply didn’t exist in previous cycles.
The key thing to understand about this institutional structure is its impact on on-chain data. When BlackRock buys Bitcoin for its IBIT, those tokens are transferred to Coinbase Prime for custody, becoming almost invisible to on-chain analysis in the way retail activity is tracked. ETF purchases don’t show up on-chain as tokens changing hands in the same way retail trades do. MicroStrategy’s Bitcoin accumulated through equity offerings is reflected in SEC filings, not on-chain. Every dollar of demand generated less on-chain activity than in any previous cycle.
This is the core technical reason why every top indicator failed. These indicators measure activity on the blockchain, token movements, and realized profit behavior—metrics whose effectiveness presumes retail as the dominant buyer. When the dominant buyers operate through off-chain custodians and registered financial products, these indicators appear remarkably calm, even as tens of billions of dollars flow into the asset. The math of the indicators wasn’t wrong; they were measuring the wrong thing.
Why Did All Eight Top Indicators Fail?
These indicators once boasted a near-perfect track record. In 2013, 2017, and 2021, they signaled a market top within days or weeks of the actual peak. Analysts obsessively monitored them throughout 2025, waiting for a signal. Bitcoin broke $126,000 and then began to fall. Yet, all these indicators remained calmly in neutral or accumulation zones.
This wasn’t because the indicators were broken. It was because the market they were designed to measure no longer existed. Understanding why each indicator failed offers deeper insight into the current market structure than any price chart.
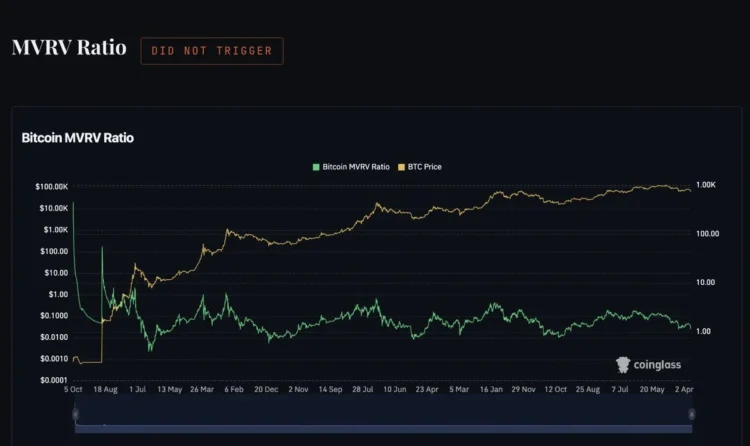
Bitcoin’s MVRV Ratio: Peaked at approximately 3.8 at the 2025 top, while previous cycle peaks were between 7 and 10 (Source: Coinglass).
MVRV Ratio
The MVRV Ratio divides Bitcoin’s market capitalization by its realized capitalization (the sum of all tokens’ prices when they last moved on-chain). When this ratio is very high, it means the average holder is sitting on extremely high unrealized profits, historically coinciding with peak speculation. At the 2013 top, the ratio exceeded 10; in 2017, it approached 8; in 2021, it reached 7. The accepted danger threshold is greater than 7.
At the October 2025 peak, MVRV only reached approximately 3.8 to 4.2. At a new all-time high, the indicator was less than half the historical warning level. The reason lies in market structure: ETF buyers and MicroStrategy’s accumulation reflected demand in Bitcoin’s price but did not move tokens in the on-chain manner required for MVRV calculation. Billions of dollars worth of Bitcoin sat in Coinbase Prime custody wallets on behalf of institutional clients, never “moving” in an on-chain sense since being purchased. Realized capitalization was artificially suppressed because the largest buyers this cycle operated through custodians largely invisible to on-chain measurement. Thus, when the price was at its highest, MVRV indicated a market still in its mid-cycle phase.
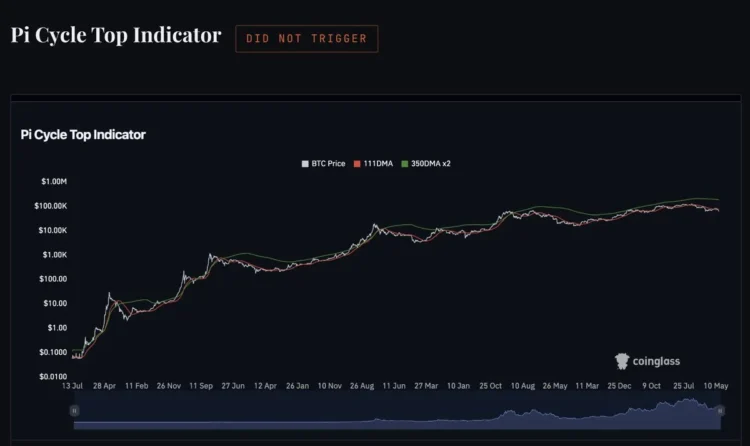
Pi Cycle Top Indicator: The 111-day moving average (DMA) never crossed above twice the 350-day moving average (350-DMA×2). In previous tops, the crossover often occurred within days of the actual peak (Source: Coinglass).
Pi Cycle Top Indicator
The Pi Cycle indicator triggers when the 111-day moving average crosses above twice the 350-day moving average. It’s one of Bitcoin’s most precise top signals, hitting within days of the actual peak in 2013, 2017, and 2021. Many analysts in 2025 predicted a crossover in September of that year.
But it didn’t happen. The two lines converged and then diverged again without crossing. The reason directly relates to institutional demand: the Pi Cycle crossover requires a sharp, accelerating price increase to push the short-term average above the long-term one. Institutional buyers, operating on quarterly allocation schedules, do not generate this acceleration. They bring steady, sustained gains. A 215% increase from $40,000 to $126,000 over 20 months, while potentially as large as a retail-driven parabolic surge in total, has a fundamentally different angle of ascent, which is what the Pi Cycle indicator measures. Because the angle of ascent to the top did not meet the trigger conditions, the indicator remained silent even as a new all-time high was reached.
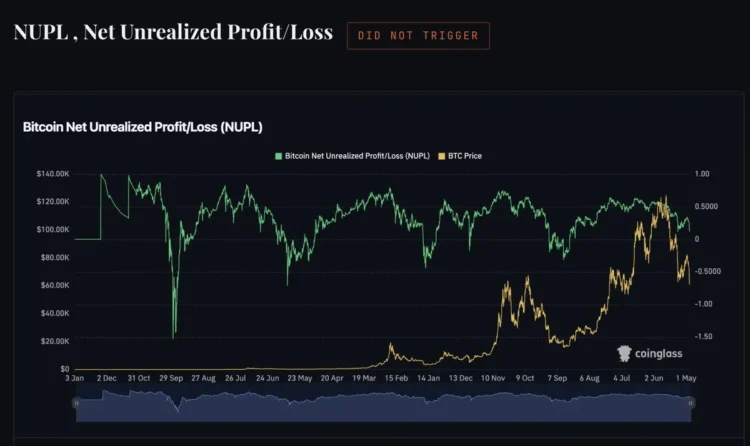
Bitcoin’s NUPL: Never broke above 0.75 (Frenzy zone) at the 2025 top. Previous cycle peaks were well above this threshold (Source: Coinglass).
Net Unrealized Profit/Loss (NUPL)
NUPL measures the ratio of unrealized profits to unrealized losses across the entire Bitcoin network. When this value exceeds 0.75, the market is categorized as being in a state of frenzy. In this state, the vast majority of holders are sitting on massive profits, making a large-scale sell-off highly probable. At previous cycle tops, NUPL was deeply entrenched in the frenzy zone, in some cases even approaching 1.0.
At the October 2025 top, NUPL peaked only around 0.60 to 0.65. This indicator showed the market in a belief phase—confident but not frenzied—and for the holders it *could* monitor, this reading was accurate. Bitcoin long-term holders who accumulated in 2022 and 2023 were highly disciplined. They were not the panic-profit-takers that a frenzy reading requires. And the retail participants who *should* have pushed NUPL into the danger zone weren’t buying Bitcoin; they were speculating on memecoins. NUPL accurately depicted the state of the on-chain holders it could measure, but it couldn’t see the $63 billion sitting in ETF custodians.
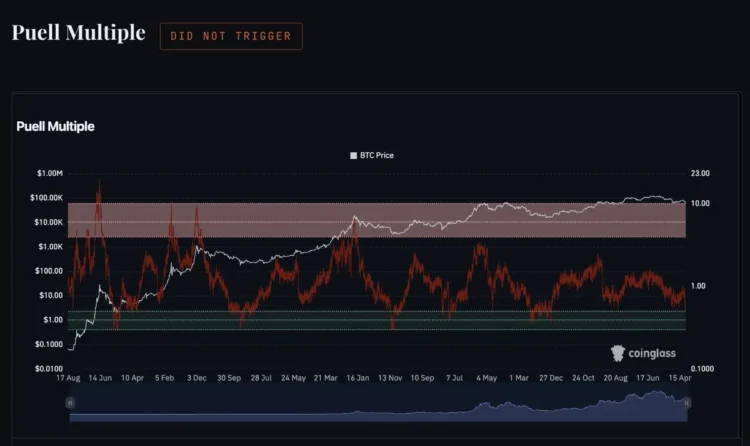
Puell Multiple: Remained around 1.0 throughout the 2025 bull run. Historical highs were 3.4, 6.6, and 10.48, respectively (Source: Coinglass).
Puell Multiple
The Puell Multiple compares miners’ daily revenue to their 365-day average. When miners’ revenue significantly exceeds their annual average (typically due to a price surge), they aggressively sell to lock in profits, creating supply pressure that historically signals a cycle top. Previous top readings: 10.48 in 2013, 6.6 in 2017, and 3.4 in 2021. This trend was already declining across cycles.
In 2025, due to the April 2024 halving reducing block rewards from 6.25 BTC to 3.125 BTC, miners’ revenue per block was already structurally lower than in previous cycles. Although Bitcoin’s price doubled, the halving cut the number of tokens miners received. Consequently, the Puell Multiple barely exceeded 1.0. Beyond the halving’s math, the nature of modern mining has fundamentally changed from 2013 or 2017. Large, publicly traded miners hedge risk and have institutional-grade treasury management systems; they no longer need to dump tokens at price peaks like early miners. This indicator was tailored for a mining industry that no longer exists in the same form, and its utility diminishes with each halving.
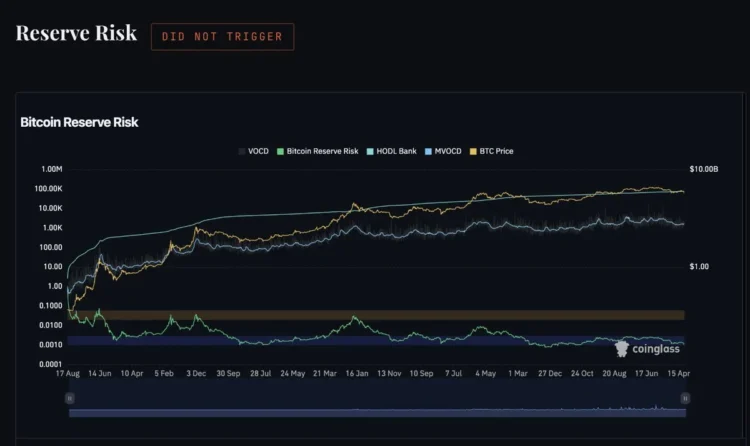
Bitcoin’s Reserve Risk: Remained deep in the accumulation zone throughout the 2025 bull run, never approaching the orange or red zones (Source: Coinglass).
Reserve Risk
Reserve Risk measures the confidence of long-term holders relative to the current price. When a long-term holder decides to sell after holding for some time, the opportunity cost of holding (the “HODL bank”) is released. When many long-term holders sell simultaneously at high prices, Reserve Risk surges into the danger zone. At previous cycle tops, this indicator would enter the orange and red zones as long-term holders finally succumbed to profit-taking.
In 2025, Reserve Risk remained deeply in the accumulation zone throughout the bull market. Long-term holders simply did not engage in the mass selling required to move the indicator. This is the most direct fingerprint of the institutional era: the largest holders—from ETF custodians, MicroStrategy, and the disciplined retail long-term holders who survived the 2022 bear market—held firm throughout the rally. They were not impulsive sellers, so they didn’t push Reserve Risk into the red zone. The indicator accurately measured their behavior. It was just that their behavior, at price points that historically should have triggered massive selling, was remarkably rational and disciplined.
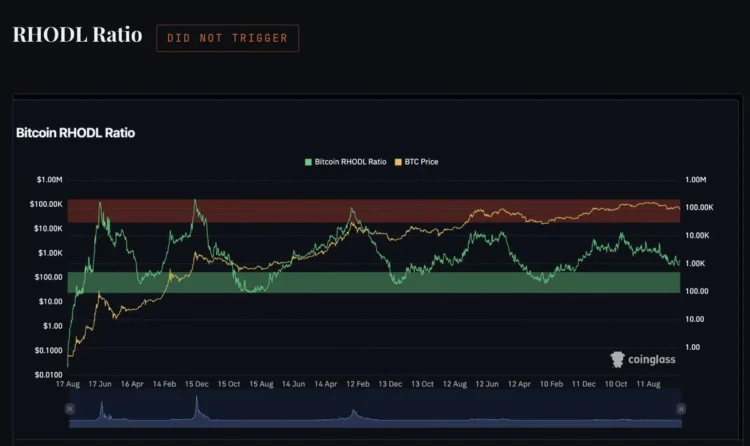
Bitcoin’s RHODL Ratio: Rose from its lows but never entered the historical red band typically associated with cycle tops (Source: Coinglass).
RHODL Ratio
The RHODL Ratio compares the realized wealth of tokens moved in the last week to tokens that haven’t moved in 1 to 2 years. A high ratio signifies a market dominated by fresh capital, i.e., new buyers entering at high prices. This is characteristic of a parabolic top: late-stage retail capital piling in at the highest points. At the top of every previous cycle, this indicator would enter the red zone as new entrants flooded the market in the final weeks.
In 2025, RHODL rebounded from bear market lows but never entered the red band. The fresh capital that would have pushed this indicator to extremes simply wasn’t in Bitcoin; it was in memecoins. The retail FOMO that RHODL measures was diverted to an entirely different part of the crypto market, where it was annihilated, rather than in Bitcoin. RHODL accurately depicted the situation: at the top, new retail capital was not dominating the Bitcoin market. The indicator just didn’t know *why*, as there was no equivalent tool to measure where retail capital *did* flow.
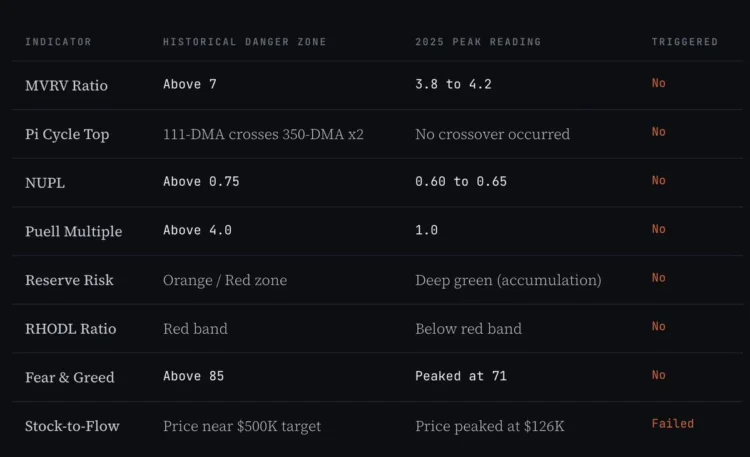
A comprehensive look at how these eight indicators performed at a cycle top leads to the conclusion that the indicators were not faulty. Instead, they accurately measured a market that no longer possessed the retail-dominated structure they were designed for. All these tools were developed in an era where Bitcoin’s price was almost entirely driven by retail speculation. They were calibrated to detect retail euphoria. In this cycle, retail euphoria did not happen in Bitcoin. These tools accurately reported that fact. The only error was the assumption that a typical retail-fueled parabolic rally was the *only* way for the cycle to top.
The cycle did top, after all. It just topped in an institutional way: slow, without fireworks, and without triggering any alarms.
Beyond the Cycle Itself, Nothing Worked
After examining all available indicators this cycle, an honest conclusion emerges: almost no metric provided a reliable top signal.
On-chain indicators collectively went silent: MVRV, Pi Cycle, NUPL, Puell, Reserve Risk, and RHODL all failed to enter dangerous territory at the peak. Macro indicators, cherished by many analysts—global M2 money supply and the US Dollar Index (DXY)—also broke down in an unsettling way. Global M2 continued to rise after Bitcoin topped in October 2025, meaning this correlation failed precisely when it was most needed. And the DXY correlation? Despite DXY recording one of its worst annual performances in decades in 2025 (dropping ~11-12%), which should have been a tailwind, not a headwind, Bitcoin still closed 2025 with negative returns. This correlation failed in both directions.
So what *did* trigger? The 4-year cycle *timing itself*. If you simply circled October 2025 on a calendar (one year after the halving, aligning with the 2013, 2017, and 2021 peak time patterns), you would have been correct. This wasn’t based on any complex analysis of on-chain data or macro correlations, but simply because the cycle’s clock struck on time.
This is the unsettling conclusion this cycle forces us to confront. The tools we built to identify tops, the macro correlations we trusted, the sentiment indicators we obsessively monitored—none of them triggered. The only thing that worked was the simplest thing: the 4-year halving cycle timing that has remained constant since 2012.
What will the next cycle bring? No one can say for sure. In 2020, institutional buying or the halving itself was expected to drive the rally. What actually happened was a global pandemic, trillions in money printing, and a risk-asset frenzy no one foresaw. The specific catalyst driving the 2028-2029 cycle could be anything: an AI bubble bursting and liquidity flowing back into crypto, new US crypto regulations unlocking institutional capital, a Fed pivot due to recession, or something no one has thought of yet. Trying to predict the specific *why* may be futile. History tells us the cycle will continue. Its specific mechanisms, however, will surprise everyone.
Currently in a Mid-Bear Market, Not Yet Bottomed
Bitcoin is currently trading between $62,000 and $63,000. This is approximately 50% down from its all-time high of $126,296 reached in October 2025. The current market structure aligns with a mid-bear market—not bottomed, but not in freefall either.
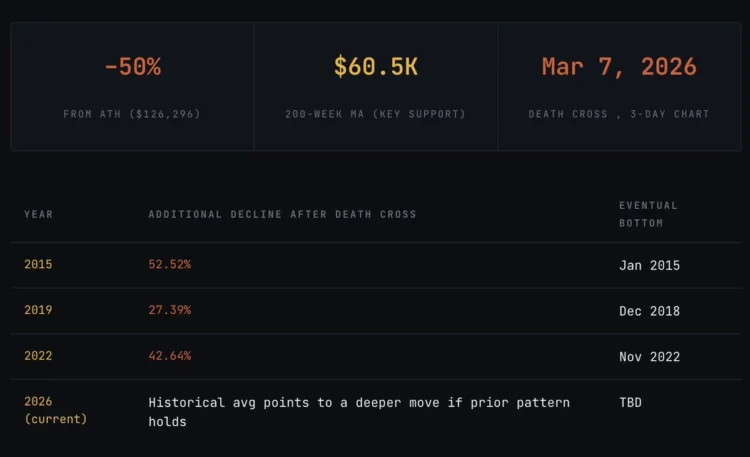
The most structurally important level currently is the 200-week Exponential Moving Average (EMA 200), which sits around $68,832 on the weekly chart. In every previous bear market, Bitcoin found its bottom support at or near this level. The 2015 and 2022 bear markets both saw Bitcoin consolidate around the weekly 200 EMA before starting the next bull run. The 200-week MA is not a precise bottom signal; it’s a zone. Historically, Bitcoin has dipped slightly below this line before reversing, testing the market’s resolve before the next accumulation phase begins.
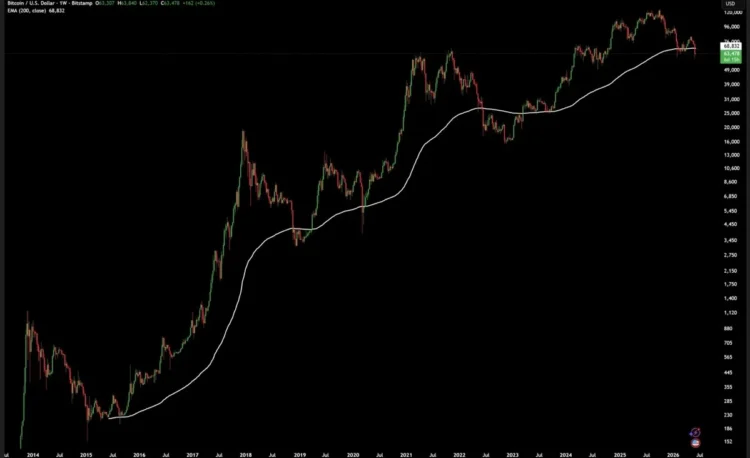
Bitcoin weekly chart with 200 EMA: Every bear market cycle found support at or near this level before initiating the next bull run (Source: Bitstamp).
On March 7, 2026, a death cross formed on Bitcoin’s 3-day chart. This is the same signal that appeared before significant declines in 2014, 2018, and 2022. Reviewing previous Bitcoin drops after each 3-day death cross:
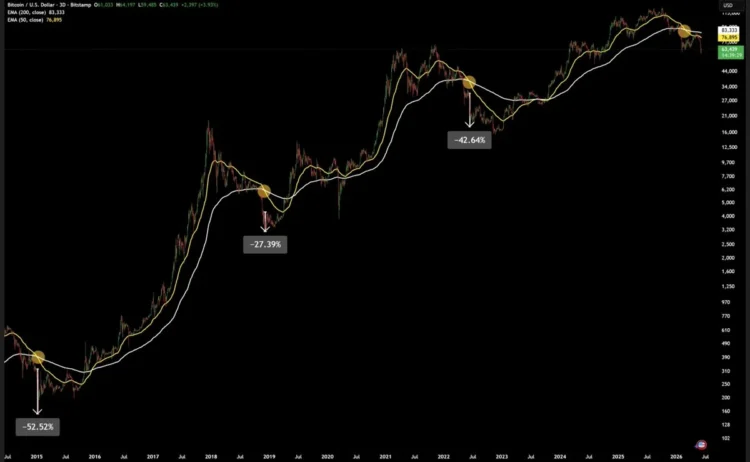
Bitcoin 3-day chart: On March 7, 2026, the EMA 50 crossed above the EMA 200 (Death Cross). Previous death crosses led to drops of 27%, 43%, and 53% from the crossover point (Source: Bitstamp).
The pessimistic forecast: If the 200-week MA fails to hold and the average historical death cross decline applies, the price could target $33,000 to $35,000. This is a number to keep in mind for a downside scenario.
The baseline scenario: Considering the trend of diminishing declines across cycles and the presence of institutional buying support not seen in previous bear markets, the bottom could be between $45,000 and $55,000. In terms of timing, applying the historical top-to-bottom rhythm, the bottom points to Q3 to Q4 2026, specifically October to November 2026, approximately one year from the peak.
What a confirmed bottom looks like: Bitcoin holds the 200-week MA for three consecutive weekly closes or more. ETF outflows stabilize after sustained withdrawals. The Fear & Greed Index rebounds from below 15 and stays above 25 for at least two weeks. When these conditions are met collectively, not just a single price level, it signals that the accumulation phase has begun.
Bottoming in 2026, Peaking in 2029?
Once the current bear market phase concludes, the cyclical framework points to the following sequence:
- Q3-Q4 2026: Bitcoin Bottoms. The 200-week MA and the realized price (around $54,000) form a support band. Historically, this is the optimal accumulation zone in any cycle—a period of extreme pessimism before the next expansion begins. This is also when most retail investors who entered near the top give up and sell, transferring tokens to long-term holders at a discount.
- 2026-2027: Accumulation Phase. Price action is sideways, boring, and volatile. No major headlines, no momentum. This phase feels like nothing is happening, which is why most people miss it. Every previous cycle had this exact phase between the bear market bottom and the start of the next bull run.
- April 2028: Next Halving. Block rewards drop from 3.125 BTC to 1.5625 BTC. Miner selling pressure is halved again. Institutional demand from the ETF complex (now far larger than today) begins to absorb the supply shock. Bitcoin starts to build momentum.
- 2028-2029: Post-Halving Expansion. If the 4-year cycle remains valid, this is the next major bull market. Based on consistent timing patterns, the peak in 2029 is most likely to occur in Q3 or Q4 of that year.
It’s crucial to note: the 2025 cycle suggests that the parabolic, frenzied topping behavior of previous cycles may not recur in the same manner. As Bitcoin’s ownership by institutions grows and retail participation accounts for a smaller percentage of total demand, the top may still arrive without extreme indicator readings, without parabolic price action, and without the obvious cycle top signals that were easily identifiable with hindsight in the past. To capitalize on the next top, you will need to rely on different tools than those that worked in 2021.
Conclusion
Bitcoin’s 4-year cycle was not broken. The top arrived on schedule, at the correct point in the halving cycle, surpassing previous highs and setting a new all-time high. The cycle operated precisely as expected.
What failed were the tools people used to identify the top. Every classic on-chain indicator went silent because every classic on-chain indicator measures retail behavior, and retail was not in Bitcoin. Retail capital was systematically drained through memecoins, celebrity tokens, and high-FDV VC token structures before it ever reached Bitcoin. By October 2025, the retail fuel that could drive a parabolic top and trigger euphoria indicators had been exhausted.
Institutional buyers—ETFs, MicroStrategy, professional asset allocators—replaced retail, generating a 215% surge from the 2024 lows to the peak. However, their operations produced no parabolic candles and triggered no alarms. Indicators suggested calm, yet the market still topped.
The only thing that truly worked was the cycle’s timing itself. October 2025, approximately 535 days after the April 2024 halving and roughly one year from the pattern-implied cycle bottom, aligned almost perfectly with historical timing. Not because of complex indicator analysis, but because the same four-year structure, unchanged since 2012, was validated once more.
Bitcoin is currently in a bear market phase consistent with all previous post-peak cycles. The 200-week EMA serves as the structural reference level that has underpinned all prior bear market bottoms. The path forward will follow the cycle’s timetable. The specific catalysts, the exact characteristics of the rally, and whether old indicators will eventually trigger—these remain unpredictable. Timing, however, is the only signal that has never failed.
(The above content is excerpted and reproduced with authorization from our partner PANews. Original Article Link)
Disclaimer: This article is for market information purposes only. All content and views are for reference only and do not constitute investment advice. They do not represent the views and positions of BlockTempo. Investors should make their own decisions and trades. The author and BlockTempo will not bear any responsibility for direct or indirect losses resulting from investor transactions.