

Unlocking Web3’s True Value: 1kx Report Reveals $20 Billion On-Chain Economy and Future Trends
In an unprecedented move to demystify the burgeoning Web3 landscape, 1kx network has unveiled its most comprehensive analysis to date: the ‘1kx On-Chain Revenue Report (H1 2025).’ This groundbreaking report meticulously compiles verified on-chain fee data from over 1200 protocols, offering unparalleled insights into user engagement, value flows, and the core drivers propelling the crypto market forward.

Why On-Chain Fees Are the Ultimate Signal of Real Demand
On-chain fees serve as the most transparent and direct indicator of genuine user demand and economic activity within the cryptocurrency ecosystem. Unlike traditional, often opaque, off-chain metrics, on-chain data offers a real-time pulse of the market:
- On-Chain Ecosystem: Characterized by openness, global accessibility, and significant investment potential.
- Off-Chain Ecosystem: Typically restricted and mature, with limited growth ceilings.
A stark comparison highlights this divergence: on-chain application fees have surged by an impressive 126% year-over-year, while their off-chain counterparts managed a mere 15% growth, underscoring the dynamic expansion of the Web3 space.
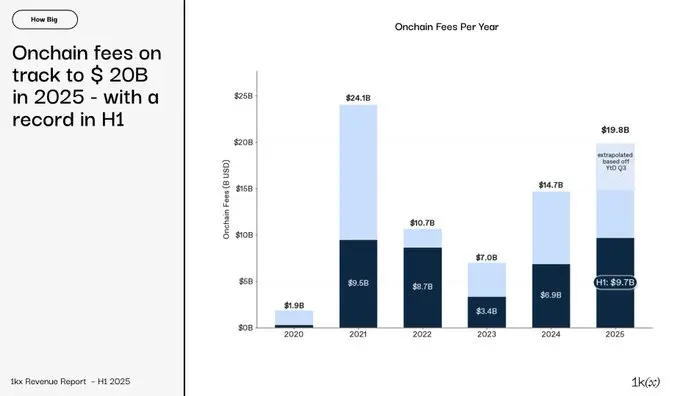
The Scale of the On-Chain Economy: From Experiment to $20 Billion Powerhouse
What began as an experimental frontier in 2020 has rapidly transformed into a robust, real-time measurable $20 billion economy by 2025. This burgeoning ecosystem sees users actively paying for a diverse array of application scenarios, from trading and asset exchange to data storage and seamless cross-application collaboration.
Our analysis reveals that an astounding 1124 protocols have achieved on-chain profitability this year alone, showcasing the widespread adoption and monetization within Web3.
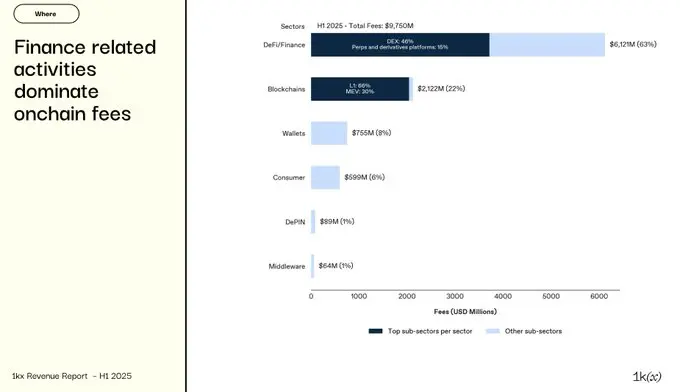
Evolving Revenue Streams: Beyond DeFi’s Dominance
While Decentralized Finance (DeFi) remains a foundational pillar, contributing 63% of total on-chain fees, the industry’s revenue landscape is undergoing rapid diversification:
- Wallet Businesses: Experiencing a remarkable 260% year-over-year growth, these platforms are transforming user interaction interfaces into significant profit centers.
- Consumer Applications: With a robust 200% growth, these apps are directly monetizing user traffic and engagement.
- DePIN (Decentralized Physical Infrastructure Networks): Skyrocketing by an astounding 400%, DePIN projects are bringing real-world computing power and connectivity services onto the blockchain, creating entirely new revenue streams.
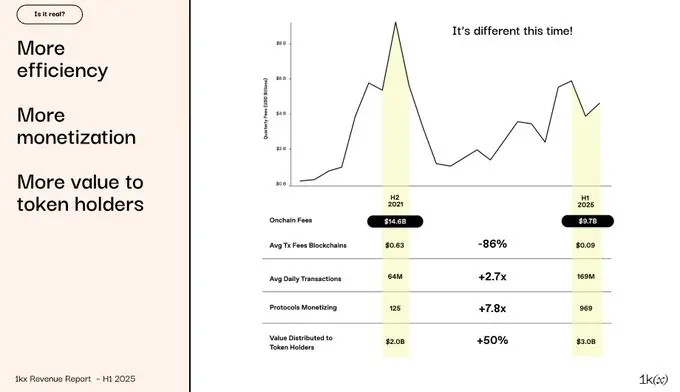
A Healthier Ecosystem: Beyond Peak Fees
Despite total fees not yet surpassing the 2021 peak, the underlying health and resilience of the on-chain ecosystem are stronger than ever. This period signifies a shift towards sustainable growth and broader participation:
- Cost Efficiency: ETH on-chain fees, which once comprised over 40% of total network costs, have seen transaction costs plummet by 86%, making the ecosystem more accessible and efficient.
- Wider Participation: The number of profitable protocols has expanded eightfold, indicating a more distributed and robust economic base.
- Value Distribution: Token holder dividends have reached an all-time high, demonstrating a maturing model for value sharing and community engagement.
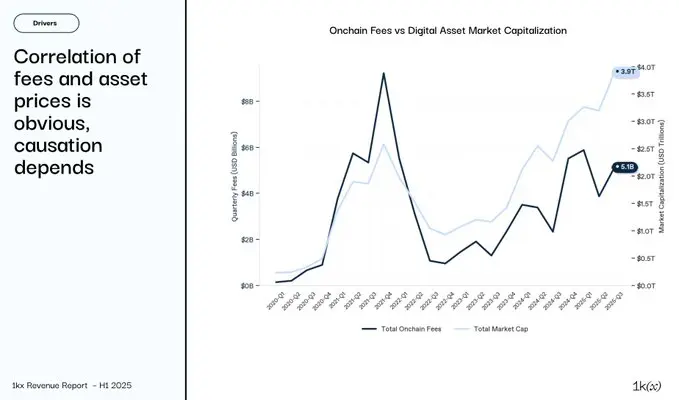
Key Drivers Shaping On-Chain Profitability
Asset prices undeniably influence USD-denominated on-chain fees, aligning with market expectations. However, deeper dynamics are at play:
- Seasonal Cycles: Price volatility continues to induce cyclical patterns in fee generation.
- Application-Valuation Nexus: Post-2021, a strong causal relationship has emerged where growth in application fees directly propels protocol valuations.
- Sector-Specific Catalysts: Distinct on-chain factors within specific sectors significantly impact their fee generation capabilities.
The Winners’ Circle: Dynamic Leadership and Valuation Paradoxes
The top 20 protocols command a substantial 70% of total on-chain fees, yet their rankings are in constant flux—a testament to the unparalleled pace of disruption within the crypto space.
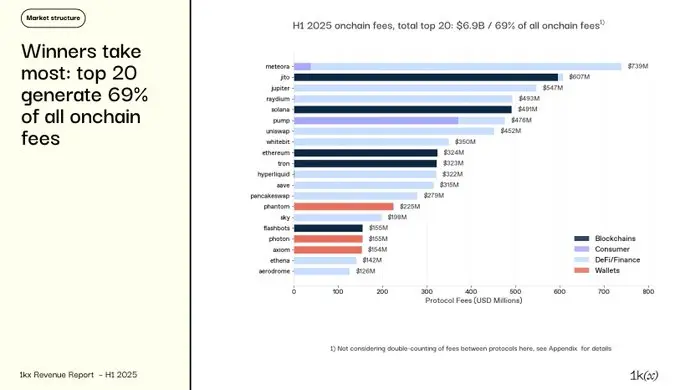
The current TOP 5 leaders by fees are: Meteora, Jito, Jupiter, Raydium, and Solana.
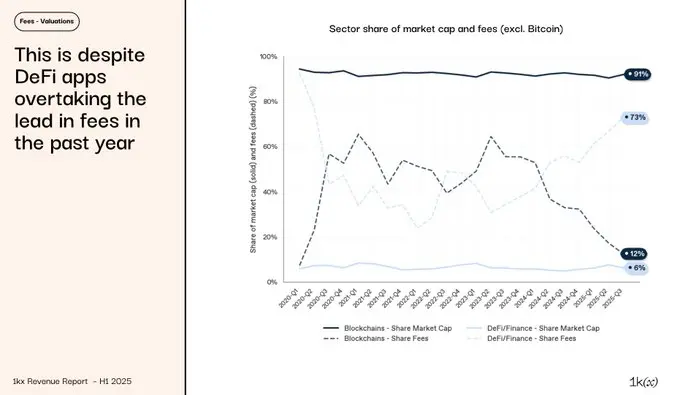
Intriguingly, a significant divergence exists between fee generation and valuation. While application-layer projects are dominant fee generators, their market capitalization share has remained relatively stable. Why this disparity?
The market’s valuation logic for application projects often mirrors traditional enterprises, with DeFi projects, for instance, showing a P/E ratio of approximately 17x. In contrast, public chains command valuations as high as 3,900x, reflecting their “narrative value” as a store of value or foundational national-level infrastructure.
The Future of On-Chain Fees: A Path to Maturity
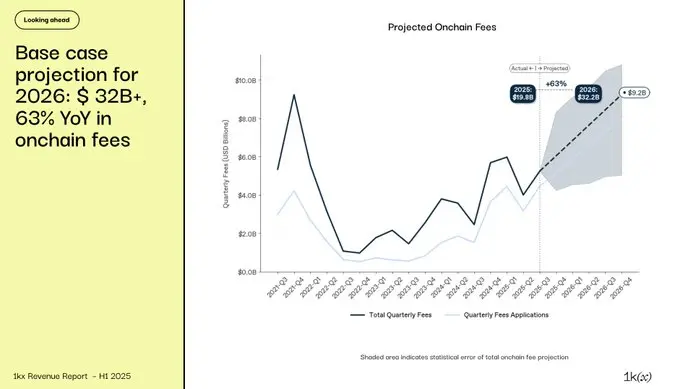
Our baseline projections indicate a robust future for on-chain fees, forecasting a breakthrough to over $32 billion by 2026, representing a 63% year-over-year increase. This growth will be predominantly driven by the application layer.
Key sectors such as Real World Assets (RWA), DePIN, wallet services, and consumer applications are entering an accelerated development phase. Concurrently, as scaling technologies continue to advance, Layer 1 (L1) fees are expected to stabilize, further optimizing the ecosystem.
Bolstered by increasingly favorable regulatory developments, we believe this marks the dawn of the crypto industry’s true maturity. As application scale, fee revenue, and value distribution converge synergistically, the Web3 economy is poised for unprecedented, sustainable growth.