

Source: Chainalysis
Compiled by: Felix, PANews
North Korea’s Evolving Crypto Threat: Insights from the 2025 Hacking Report
The cryptocurrency industry continues to face persistent and evolving threats from sophisticated cybercriminals. Chainalysis’s comprehensive 2025 Hacking Report delves deep into the tactics and impact of North Korean state-sponsored hackers, whose activities remain a primary concern for blockchain security. This analysis provides a critical overview of the year’s most significant trends in stolen crypto funds, offering crucial insights for the industry.
Key Findings from the 2025 Crypto Hacking Landscape:
- North Korea’s Record Haul: North Korean hackers stole an unprecedented $2.02 billion in cryptocurrency in 2025, marking a 51% year-over-year increase. Despite a reduction in the number of attacks, their cumulative theft total has reached an alarming $6.75 billion.
- Sophisticated Attack Vectors: These state-sponsored actors are executing fewer but more lucrative attacks, often by infiltrating IT personnel within crypto services or employing elaborate impersonation strategies targeting high-level executives.
- Distinct Laundering Patterns: North Korean hackers exhibit a clear preference for Chinese money laundering services, cross-chain bridges, and mixing protocols. Notably, their money laundering cycle typically spans approximately 45 days following major theft incidents.
- Surge in Personal Wallet Thefts: 2025 witnessed a dramatic increase in personal wallet compromises, with 158,000 incidents affecting 80,000 users. However, the total value stolen ($713 million) saw a decrease compared to 2024’s figures.
- DeFi Security Improvements: Despite an increase in Decentralized Finance (DeFi) Total Value Locked (TVL), hacking losses in the DeFi sector remained relatively low from 2024 to 2025, suggesting that enhanced security measures are yielding tangible results.
A Challenging Year: Over $3.4 Billion Stolen in 2025
The crypto ecosystem once again faced significant challenges in 2025, with stolen funds continuing their upward trajectory. From January to early December 2025, the industry recorded over $3.4 billion in stolen assets, with a single attack on Bybit in February accounting for a staggering $1.5 billion.
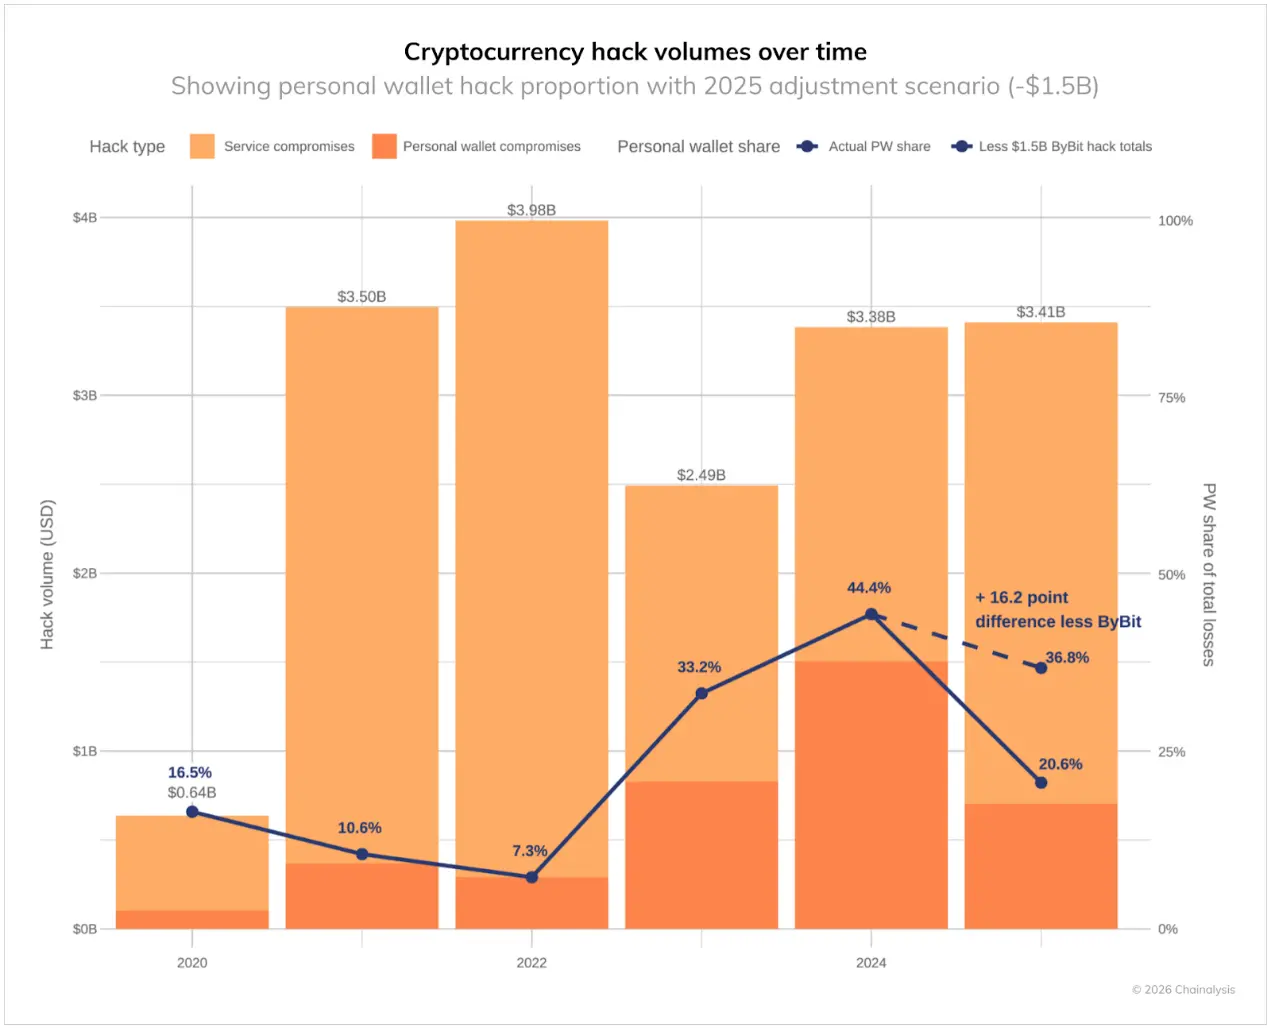
Analysis of these theft incidents reveals crucial shifts in attack patterns. Personal wallet compromises surged, escalating from 7.3% of the total stolen value in 2022 to 44% in 2024. Excluding the colossal Bybit incident, this proportion would have reached 37% in 2025.
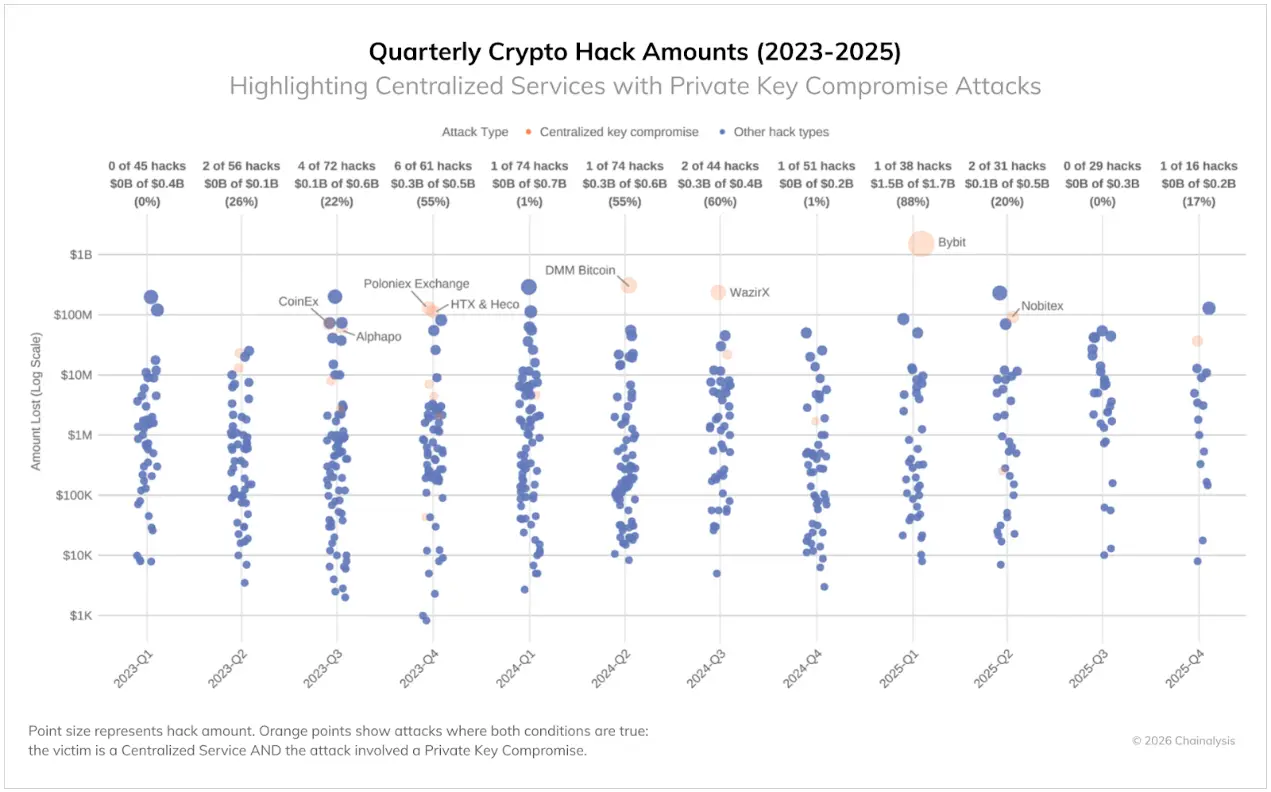
Simultaneously, centralized services are enduring increasingly severe losses due to sophisticated attacks targeting private key infrastructure and signing processes. Even platforms with substantial institutional resources and dedicated security teams remain vulnerable to threats capable of bypassing cold storage controls. While infrequent, such breaches (as illustrated below) result in immense financial losses, comprising 88% of total losses in Q1 2025. Many attackers have developed methods to exploit third-party wallet integrations and trick signers into authorizing malicious transactions.
Despite advancements in certain areas of crypto security, the persistently high volume of stolen funds underscores attackers’ continued ability to find and exploit vulnerabilities across various attack vectors.
Concentrated Damage: Top Three Hacks Account for 69% of Total Losses
Historically, fund theft events are heavily influenced by extreme outliers, with a majority of hacks being relatively small while a select few are exceptionally large. However, 2025 saw an exacerbation of this trend: the ratio between the largest hack and the median value of all incidents surpassed the 1000x threshold for the first time. The funds stolen in the largest attacks are now over 1,000 times greater than those in an average incident, even exceeding the peaks observed during the 2021 bull market. These calculations are based on the USD value of stolen funds at the time of the theft.
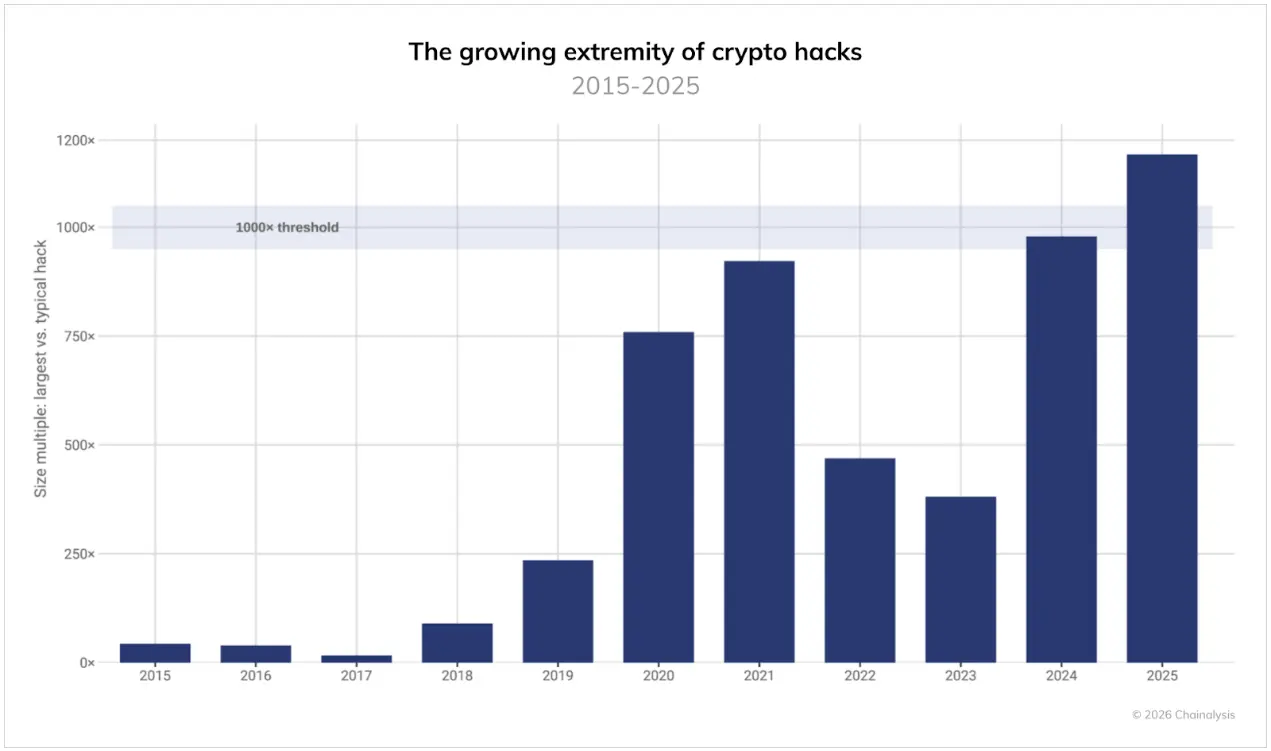
This widening disparity leads to a highly concentrated distribution of losses. The top three largest hacks in 2025 were responsible for 69% of all losses, highlighting the disproportionate impact of single events on the annual total. While attack frequency may fluctuate and median losses may increase with asset prices, the potential losses from individual major breaches are escalating at an even faster rate.
North Korea: A Persistent and Evolving Threat Despite Fewer Attacks
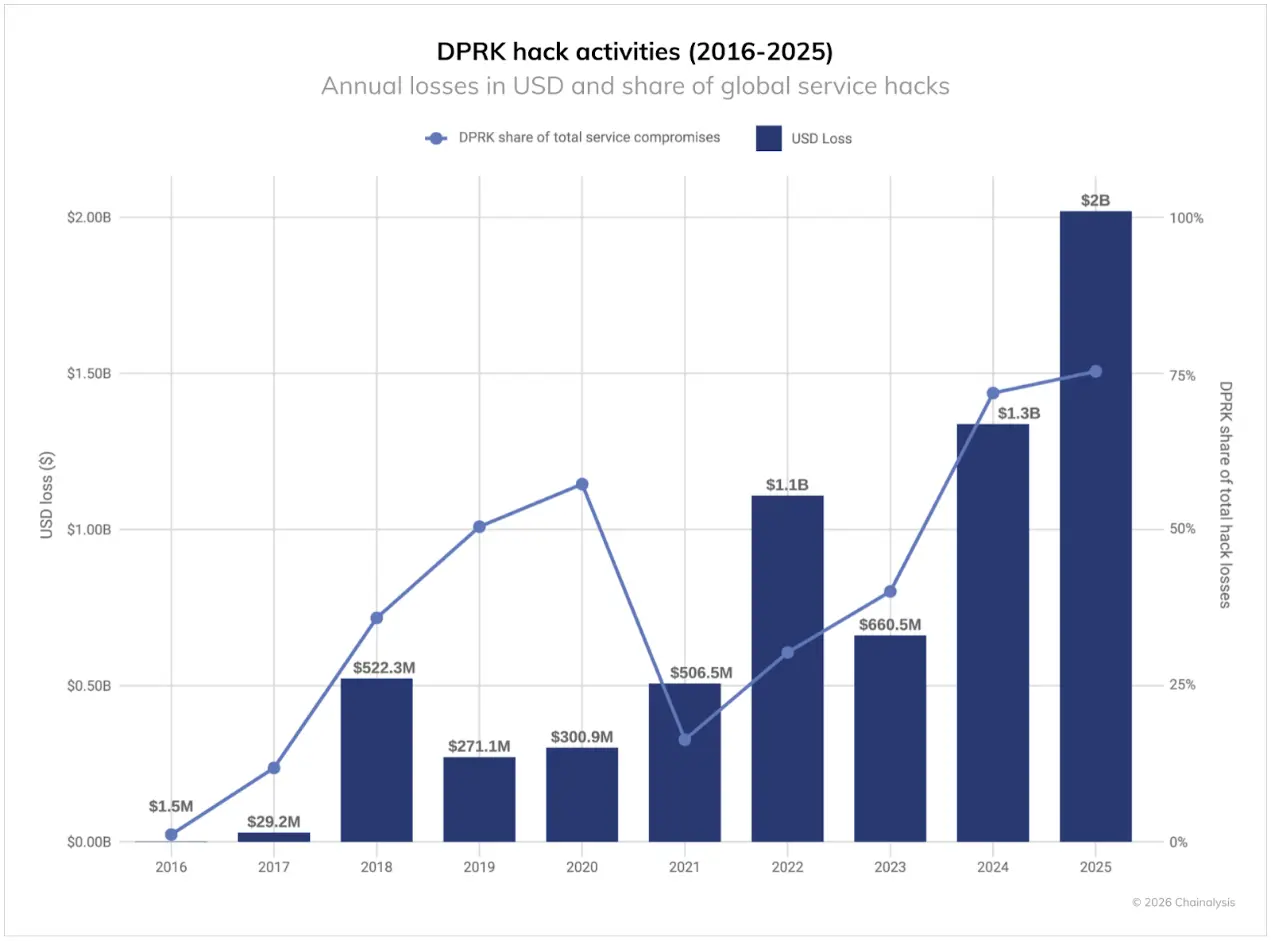
Despite a significant reduction in attack frequency, North Korea remains the most formidable threat to crypto security. In 2025, the nation’s state-sponsored hackers stole a record-breaking $2.02 billion in cryptocurrency—an increase of $681 million (51%) from 2024. This marks North Korea’s most devastating year for crypto theft by value, with their attacks constituting 76% of all recorded intrusions. Overall, the cumulative estimated value of cryptocurrency stolen by North Korea now stands at a minimum of $6.75 billion.
North Korean hackers are increasingly deploying a primary tactic: infiltrating IT personnel into crypto services to gain privileged access and orchestrate major attacks. This year’s record-breaking figures may partly reflect North Korea’s growing reliance on IT staff infiltration within exchanges, custodians, and Web3 companies, which can accelerate initial access and lateral movement, thereby creating conditions for large-scale theft.
However, recent North Korea-linked hacking groups have dramatically evolved this IT worker model. Instead of merely applying for positions and infiltrating as employees, they are increasingly impersonating recruiters from prominent Web3 and AI companies. They meticulously orchestrate fake hiring processes, culminating in “technical screenings” designed to acquire victims’ login credentials, source code, and VPN or Single Sign-On (SSO) access to their current employers. At the executive level, similar social engineering tactics involve approaches from fabricated strategic investors or acquirers, who leverage pitch meetings and pseudo-due diligence to probe for sensitive system information and potentially high-value infrastructure—an evolution directly building upon North Korea’s IT worker fraud operations, with a strategic focus on critical AI and blockchain companies.
As observed in previous years, North Korea’s sustained cyberattacks consistently target significantly higher values than those of other hacking groups. As the chart below illustrates, from 2022 to 2025, North Korean hacks predominantly occupy the highest value brackets, whereas non-North Korean attacks show a more normalized distribution across all theft sizes. This pattern further indicates that when North Korean hackers strike, they aim for large services to maximize impact.
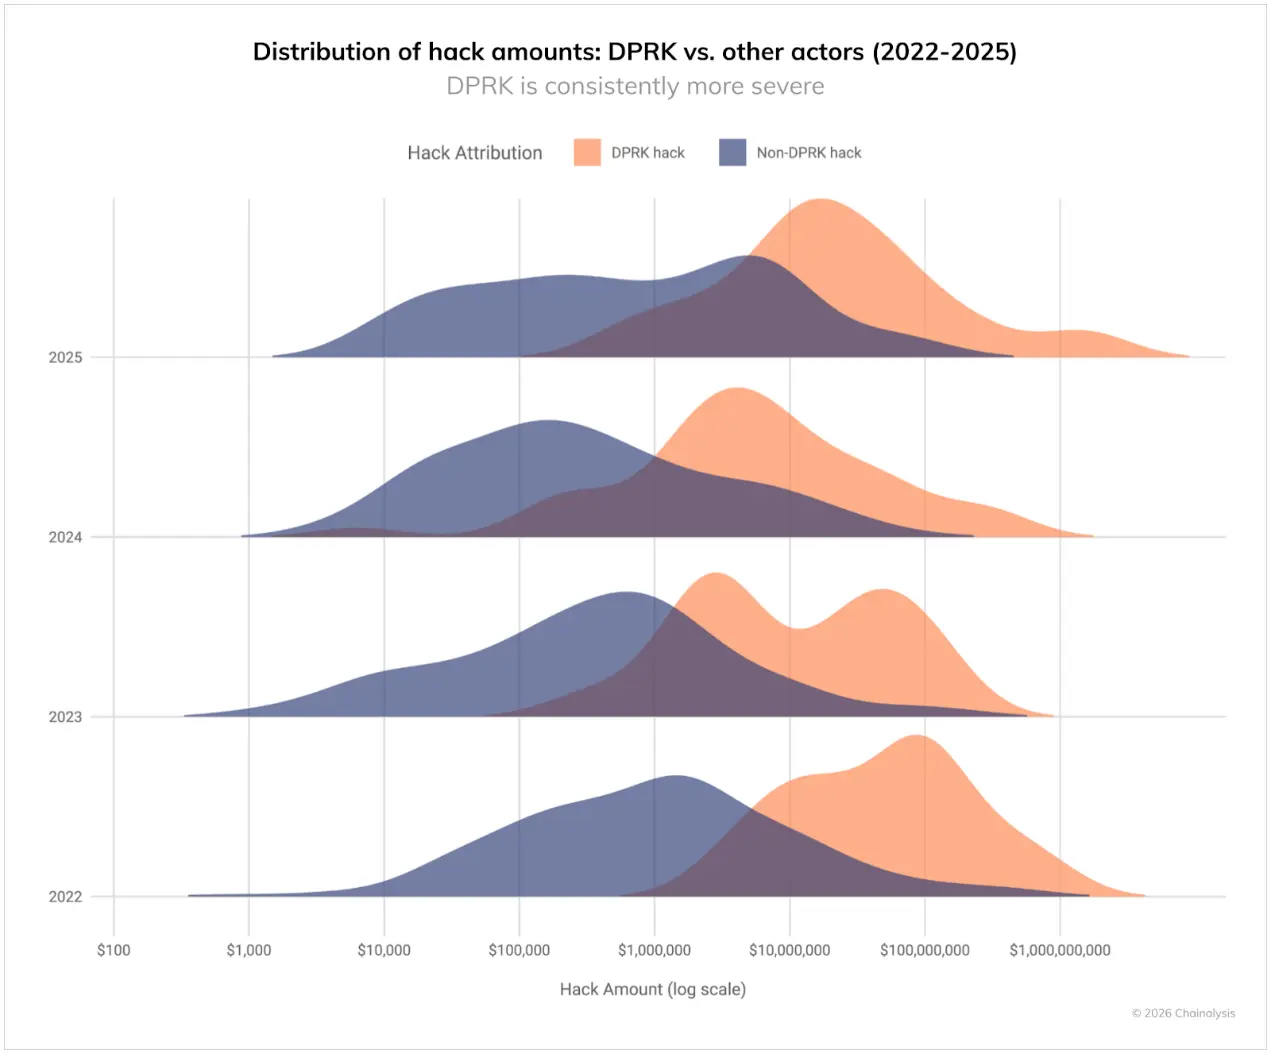
This year’s record losses stem from a drastically reduced number of known incidents. This shift—fewer incidents but significantly higher losses—primarily reflects the impact of the massive Bybit hack in February 2025.
North Korea’s Distinctive Money Laundering Patterns
The substantial influx of stolen funds in early 2025 offered a unique window into how North Korean hackers launder cryptocurrency at scale. Their patterns diverge significantly from those of other cybercriminals and have continued to evolve over time.
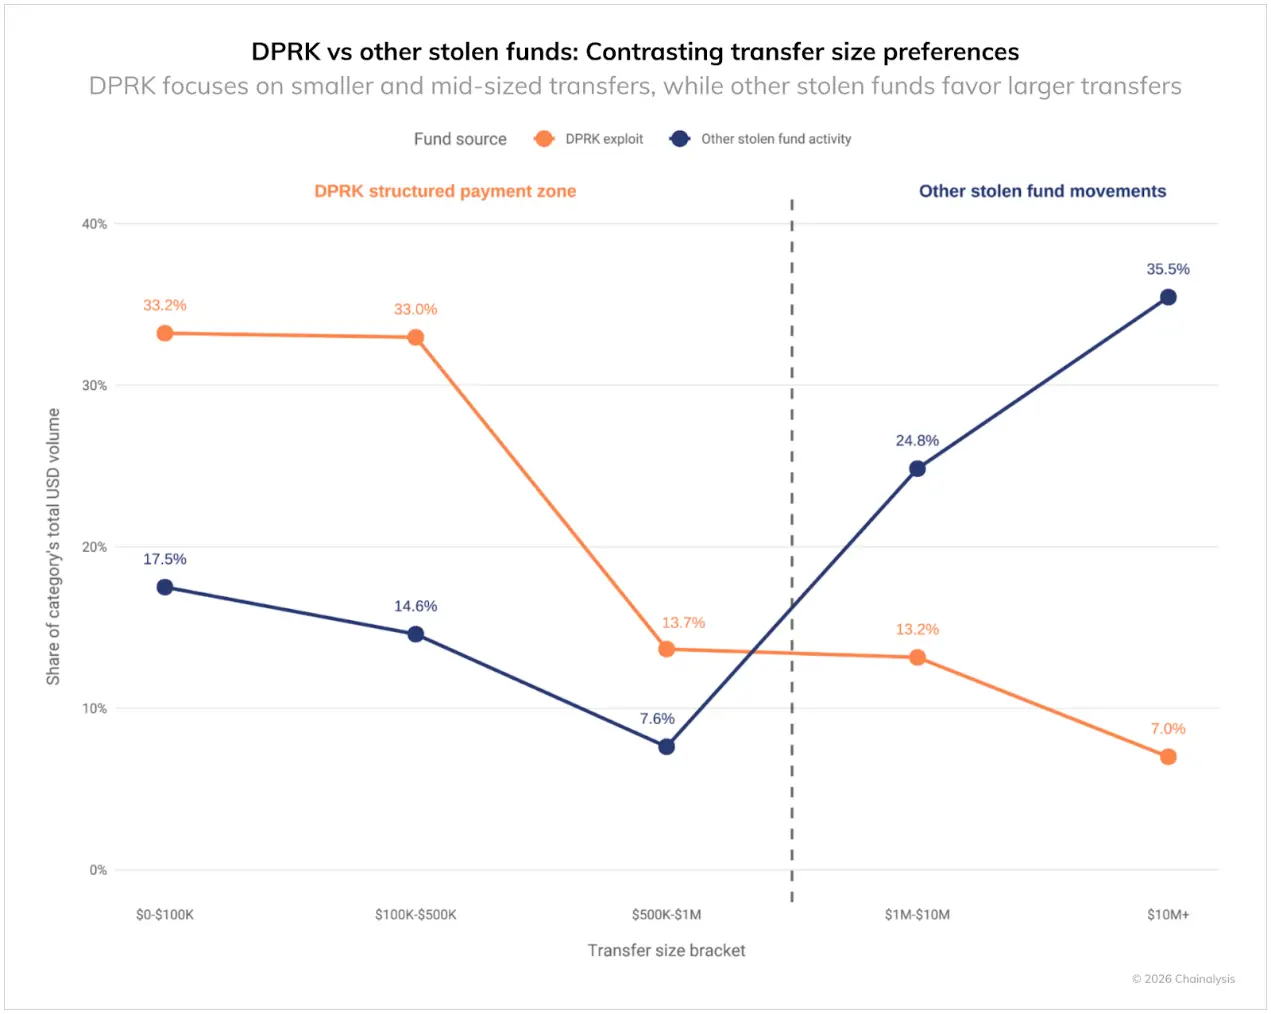
North Korean laundering activities exhibit a distinct “batching” pattern, with over 60% of transaction volume concentrated below $500,000. In contrast, other hackers typically move over 60% of their funds on-chain in batches ranging from $1 million to over $10 million. While North Korea often launders higher total amounts per incident than other hackers, they segment their on-chain transfers into smaller batches, underscoring the complexity of their laundering methodologies.
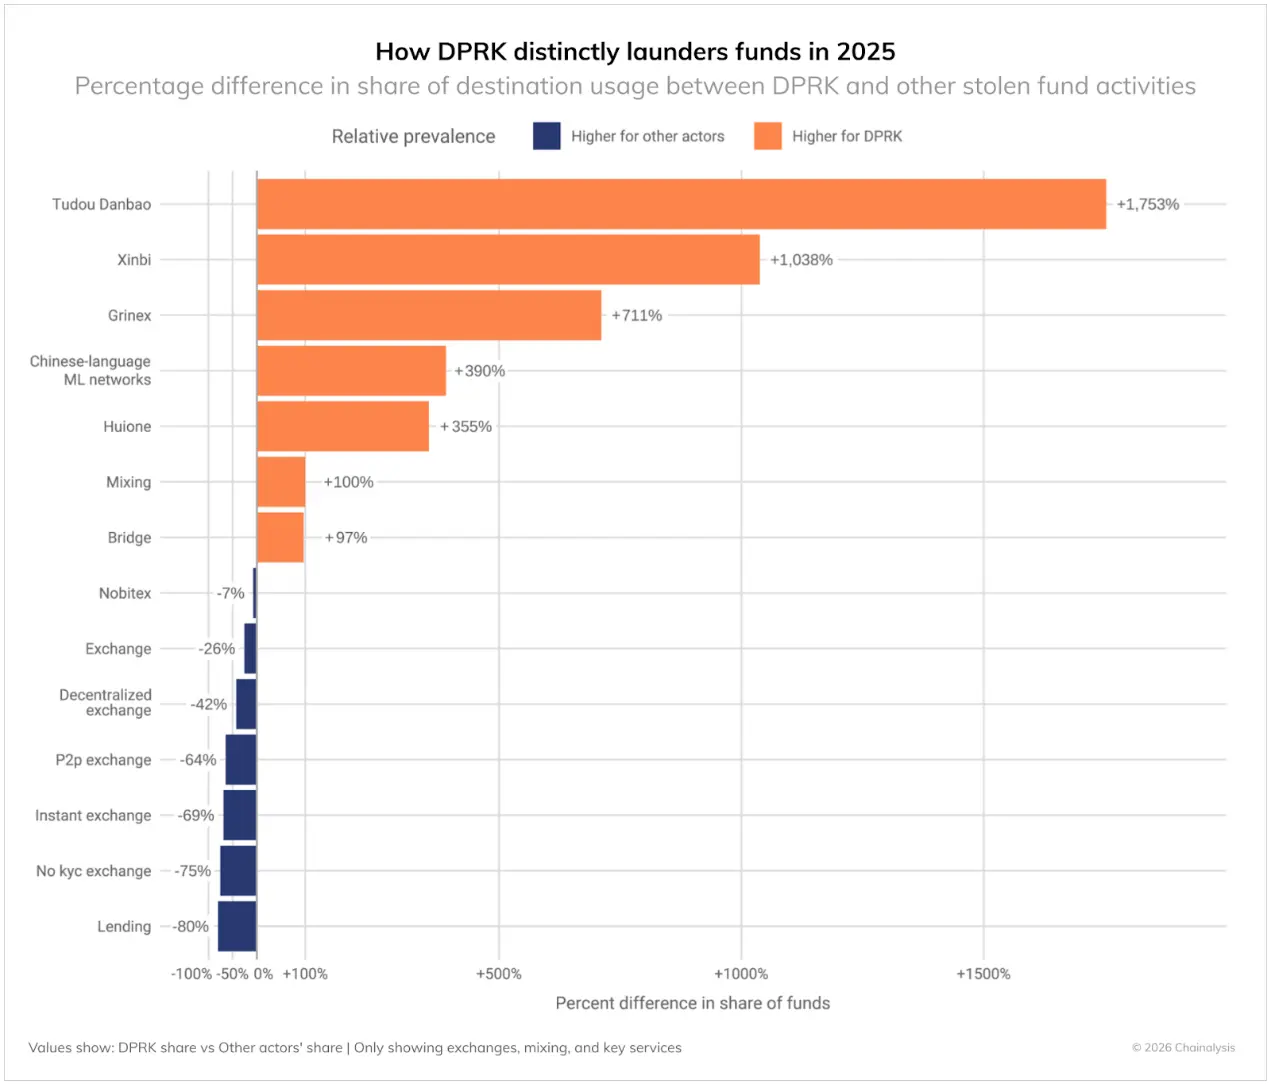
Compared to other hackers, North Korea demonstrates clear preferences for specific components within the laundering chain:
North Korean hackers typically gravitate towards:
- Chinese Fund Transfer and Escrow Services (+355% to >1000%): This is the most striking characteristic, indicating a heavy reliance on Chinese escrow services and a network of money launderers potentially operating with weaker compliance controls.
- Cross-Chain Bridge Services (+97%): A high dependency on bridges to transfer assets across different blockchains, thereby increasing the difficulty of tracing.
- Mixing Services (+100%): Greater utilization of mixers to obfuscate fund flows.
- Specialized Services like Huione (+356%): Strategic use of specific platforms to aid their laundering operations.
Other hackers involved in money laundering tend to prefer:
- Lending Protocols (-80%): North Korea avoids these DeFi services, suggesting limited integration with the broader DeFi ecosystem.
- No-KYC Exchanges (-75%): Surprisingly, other hackers use no-KYC exchanges more frequently than North Korea.
- P2P Exchanges (-64%): North Korea shows limited interest in peer-to-peer platforms.
- CEX (-25%): Other hackers engage more directly with traditional centralized exchange platforms.
- DEX (-42%): Other hackers show a greater inclination towards Decentralized Exchanges (DEXs) due to their liquidity and perceived anonymity.
These patterns suggest that North Korea’s operations are shaped by constraints and objectives that differ from those of non-state-sponsored cybercriminals. Their extensive use of specialized Chinese money laundering services and Over-The-Counter (OTC) dealers points to strong ties with illicit actors within the Asia-Pacific region.
The 45-Day Timeline: North Korea’s Post-Hack Money Laundering Cycle
An analysis of on-chain activity following North Korea-attributed hacks between 2022 and 2025 reveals a consistent pattern in how stolen funds move through the crypto ecosystem. After a major theft, these funds follow a structured, multi-stage laundering pathway that typically spans approximately 45 days:
Phase 1: Immediate Layering (Days 0-5)
The initial days post-hack see a flurry of activity focused on rapidly moving funds away from the point of theft:
- DeFi protocols experience the largest increase in stolen fund flows (+370%), serving as primary entry points.
- Mixing services also see a substantial increase in volume (+135-150%), forming the first layer of obfuscation.
- This phase represents urgent “first-step” actions designed to disassociate funds from the original theft.
Phase 2: Initial Integration (Days 6-10)
Entering the second week, the laundering strategy shifts towards services that help integrate funds into the broader ecosystem:
- Exchanges with fewer KYC restrictions (+37%) and Centralized Exchanges (CEXs) (+32%) begin to receive fund flows.
- Second-layer mixing services (+76%) continue laundering activity at a reduced intensity.
- Cross-chain bridging (e.g., XMRt, +141%) aids in dispersing and obscuring fund movement across different blockchains.
- This stage is a critical transition, as funds start moving towards potential exit avenues.
Phase 3: Long-Tail Integration (Days 20-45)
The final phase shows a distinct preference for services capable of ultimate conversion to fiat or other assets:
- Significant growth in the use of no-KYC exchanges (+82%) and escrow services (e.g., Potato Escrow, +87%).
- Instant exchanges (+61%) and Chinese platforms (e.g., Huiwang, +45%) become final conversion points.
- CEXs (+50%) also receive funds, indicating sophisticated attempts to blend stolen assets with legitimate capital.
- Less regulated jurisdictions, such as Chinese money laundering networks (+33%) and platforms like Grinex (+39%), complete this pattern.
This typical 45-day operational window for money laundering provides critical intelligence for law enforcement and compliance teams. The consistency of this pattern over several years suggests operational constraints for North Korean hackers, potentially linked to their limited access to financial infrastructure and the need to coordinate with specific intermediaries.
While these hackers do not always adhere to this exact timeline—some stolen funds may lie dormant for months or even years—this pattern represents their typical on-chain behavior when actively laundering. Furthermore, it’s crucial to acknowledge potential blind spots in this analysis, as certain activities (such as private key transfers or off-chain crypto-to-fiat conversions) are not visible on-chain without corroborating intelligence.
Personal Wallet Theft: A Growing Threat to Individual Users
Through a combination of on-chain pattern analysis and reports from victims and industry partners, the severe scale of personal wallet theft can be understood, though the true number of incidents is likely much higher. In 2025, personal wallet compromises accounted for a minimum of 20% of total losses, a decrease from 44% in 2024, indicating shifts in both scale and pattern. The total number of theft incidents surged to 158,000 in 2025, nearly tripling the 54,000 recorded in 2022. The number of victims also grew from 40,000 in 2022 to at least 80,000 in 2025. These significant increases are likely driven by the broader adoption of cryptocurrencies. For instance, Solana, one of the blockchains with the most active personal wallets, leads in the number of theft incidents, affecting approximately 26,500 victims.
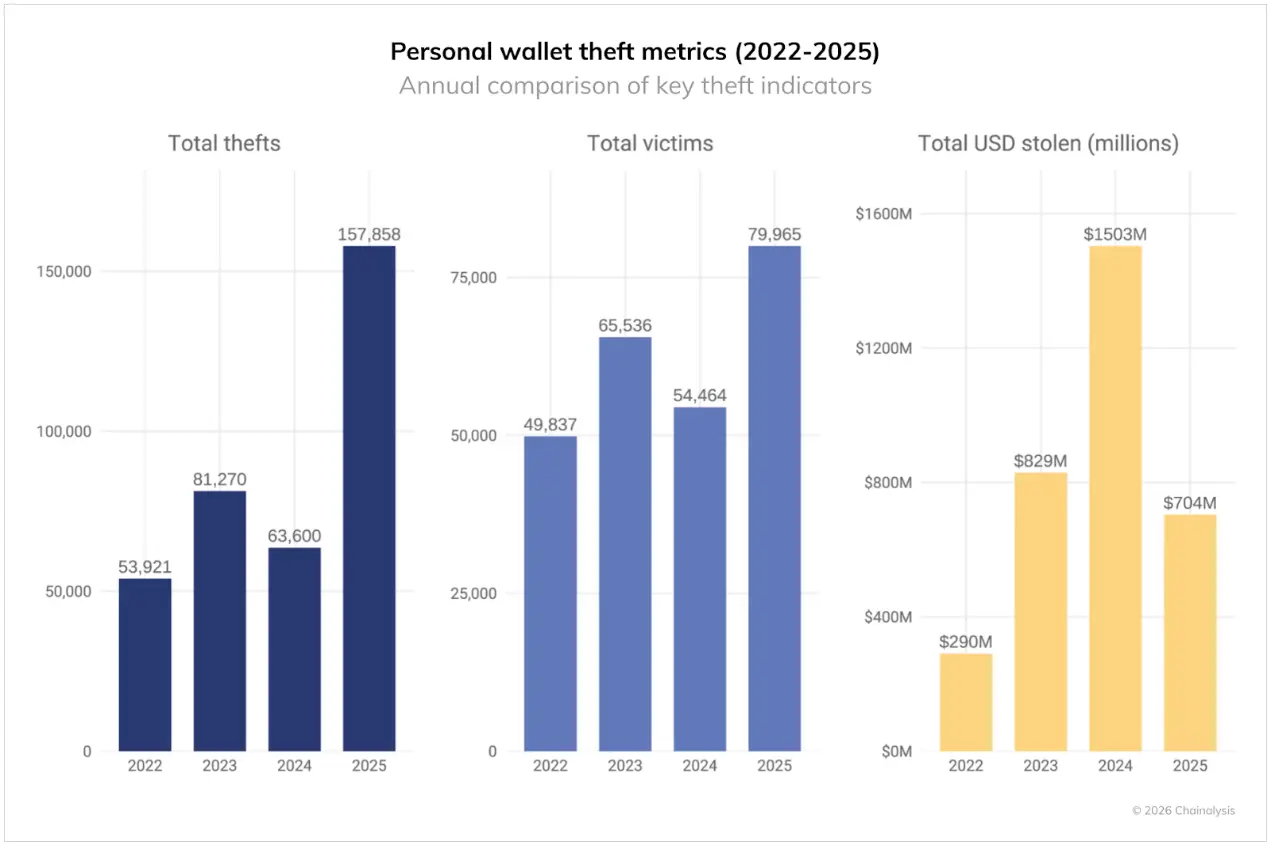
However, despite the rise in incidents and victims, the total USD value stolen per individual victim in 2025 decreased to $713 million, down from a peak of $1.5 billion in 2024. This suggests attackers are targeting a larger pool of users but stealing smaller amounts from each victim.
Network-specific victim data provides further insights into which areas pose the greatest threat to crypto users. The chart below shows victim data adjusted for the number of active personal wallets on each network. Measured as a crime rate per 100,000 wallets in 2025, Ethereum and Tron exhibit the highest theft rates. Ethereum’s large user base contributes to its high theft rate and victim count, while Tron’s ranking indicates a significant theft rate despite a smaller active wallet count. In contrast, Base and Solana show lower victim rates despite their substantial user bases.
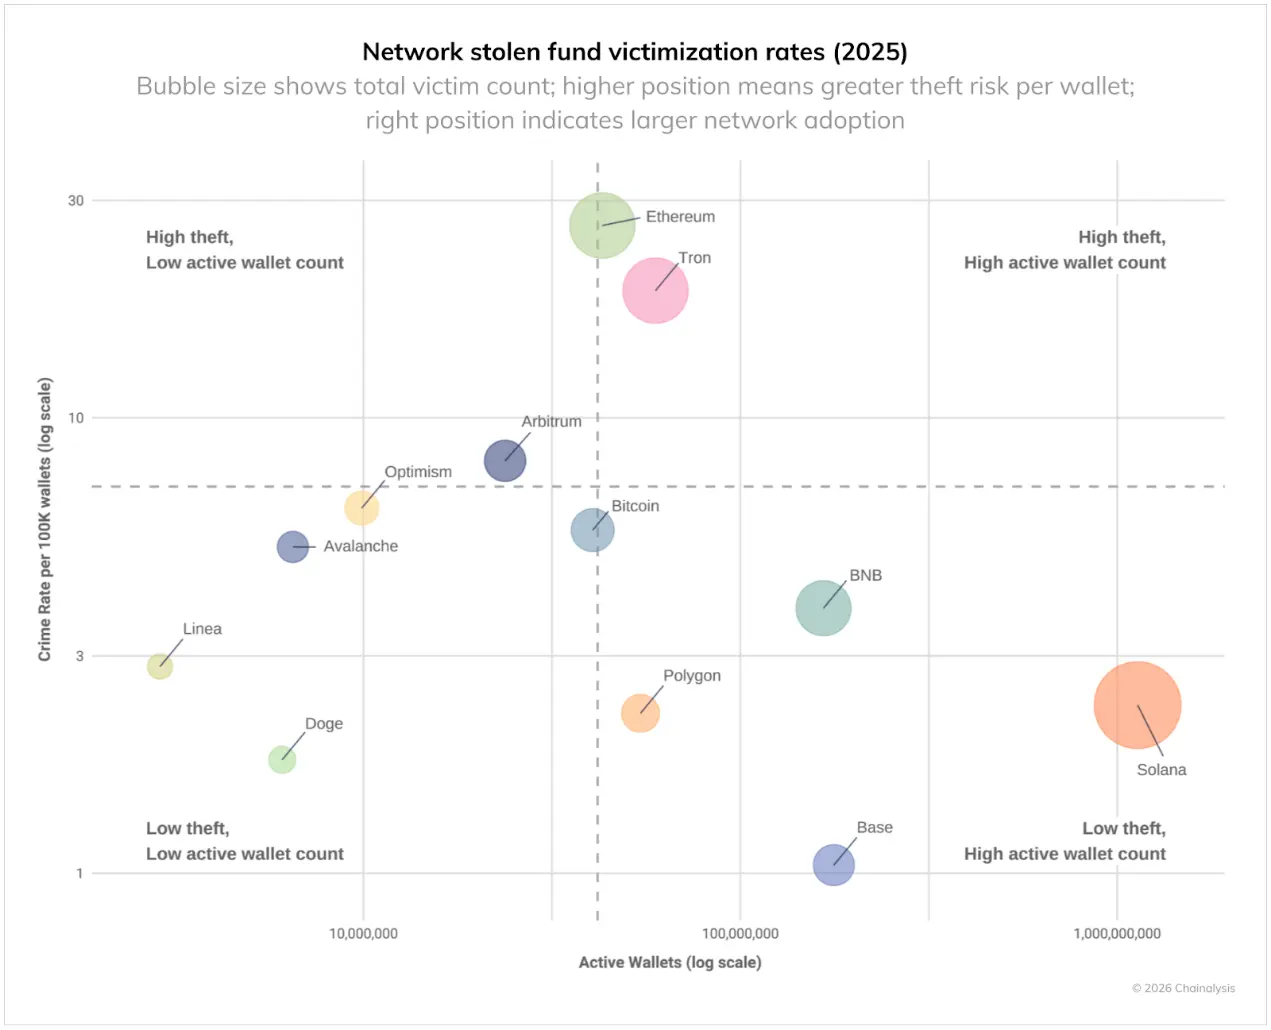
This highlights that security risks for personal wallets are not uniformly distributed across the crypto ecosystem. Differences in victim rates across blockchains, even those with similar technical architectures, suggest that factors beyond technology—such as user demographics, popular applications, and the presence of criminal infrastructure—play a crucial role in determining theft rates.
DeFi Hacking: A Diverging Pattern Signaling Market Shifts
The Decentralized Finance (DeFi) sector presented a unique pattern in 2025’s crime data, showing a clear departure from historical trends.
The data reveals three distinct phases:
- Phase 1 (2020-2021): DeFi TVL and hacking losses grew in tandem.
- Phase 2 (2022-2023): Both metrics experienced a synchronized decline.
- Phase 3 (2024-2025): TVL rebounded significantly, while hacking losses remained stable and low.
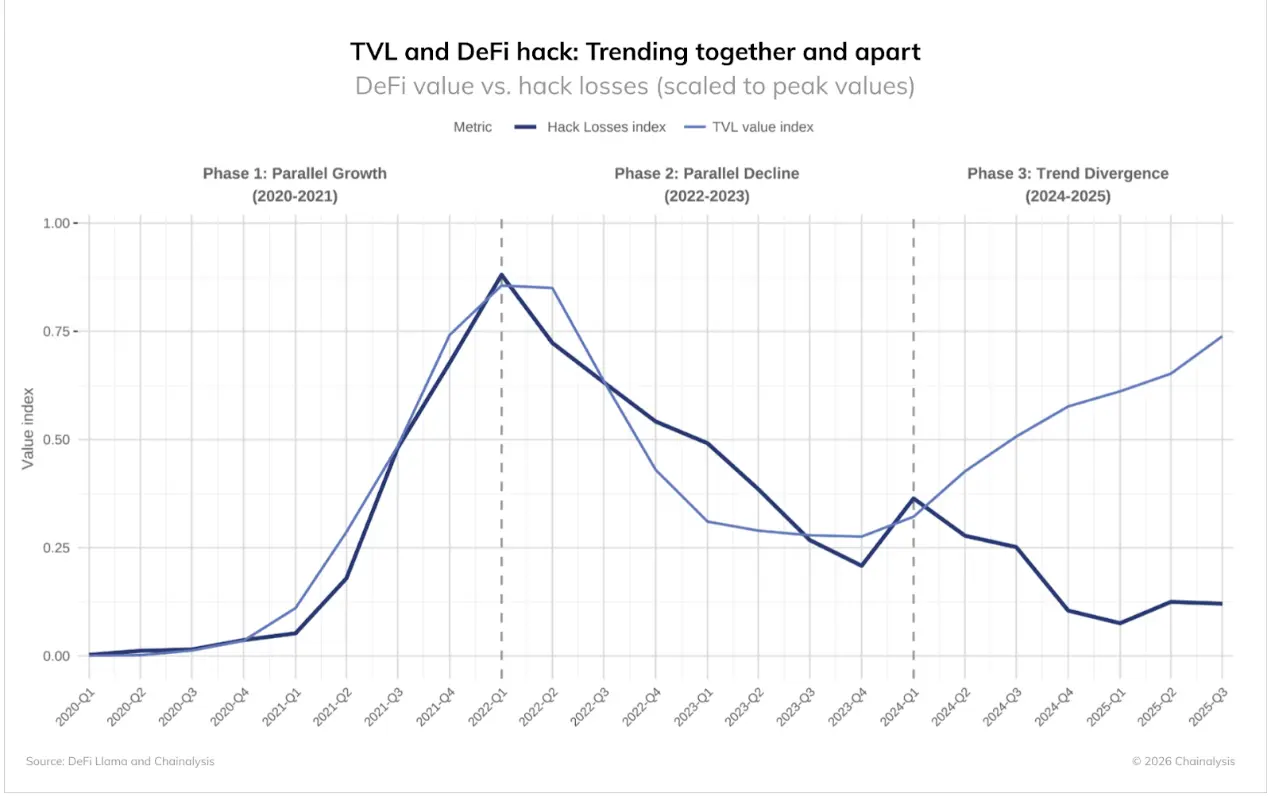
The first two phases followed an intuitive pattern: greater value at risk naturally attracts more hacking attempts, as attackers target protocols with higher potential payouts. As bank robber Willie Sutton famously said, “Because that’s where the money is.”
This makes the divergence in the third phase particularly noteworthy. While DeFi TVL has recovered substantially from its 2023 lows, hacking losses have not risen proportionally. Billions of dollars have flowed back into these protocols, yet DeFi hacking incidents have continued to remain at lower levels, representing a significant shift.
Two key factors may explain this divergence:
- Enhanced Security: The sustained decrease in hacking rates despite growing TVL suggests that DeFi protocols may be implementing more effective security measures than those in place during the 2020-2021 period.
- Shifting Targets: The concurrent increase in personal wallet thefts and attacks on centralized services indicates that attackers’ focus may be shifting to other, potentially softer, targets.
Case Study: Venus Protocol’s Exemplary Security Response
The Venus Protocol incident in September 2025 serves as a powerful example of how improved security measures are yielding real-world results. In this event, an attacker leveraged a compromised Zoom client to gain system access and tricked a user into delegating control of an account valued at $13 million—a situation that could have been catastrophic. Fortunately, Venus had activated Hexagate’s security monitoring platform just one month prior.
The platform detected suspicious activity 18 hours before the attack, issuing another immediate alert as soon as the malicious transaction occurred. Within 20 minutes, Venus paused its protocol, halting any fund outflows. This coordinated response showcased the evolution of DeFi security:
- Within 5 hours: Partial functionality was restored after security checks.
- Within 7 hours: The attacker’s wallet was force-liquidated.
- Within 12 hours: All stolen funds were recovered, and services were fully restored.
Most remarkably, Venus passed a governance proposal to freeze an additional $3 million in assets still controlled by the attacker; not only did the attacker fail to profit, but they ultimately incurred a financial loss.
This incident demonstrates a tangible improvement in DeFi security infrastructure. The combination of proactive monitoring, rapid response capabilities, and decisive governance mechanisms has made the entire ecosystem more agile and resilient. While attacks still occur, the ability to detect, respond to, and even reverse them represents a fundamental shift from the early DeFi era, where successful attacks often meant permanent losses.
Implications for 2026 and Beyond
The 2025 data paints a complex and evolving picture of North Korea as the cryptocurrency industry’s most significant threat. The nation’s ability to execute fewer but far more destructive attacks indicates increasing sophistication and patience. The impact of the Bybit incident on their annual activity patterns suggests that when North Korea successfully executes a major theft, it tends to reduce its operational tempo, shifting its focus to the intricate process of money laundering.
For the crypto industry, this evolution demands heightened vigilance for high-value targets and improved capabilities in identifying North Korea’s specific money laundering patterns. Their consistent preference for certain service types and transfer amounts offers crucial detection opportunities, distinguishing them from other cybercriminals and aiding investigators in identifying their on-chain behavioral signatures.
As North Korea continues to leverage cryptocurrency theft to finance state priorities and circumvent international sanctions, the crypto industry must recognize that their operational calculus is distinct from that of typical cybercriminals. North Korea’s record performance in 2025—achieved with a 74% reduction in known attacks—suggests that we may currently only be observing the most overt aspects of their activity. The challenge for 2026 lies in detecting and disrupting these operations before North Korea can launch another Bybit-scale attack.
(The above content is an excerpt and reproduction authorized by partner PANews. Original link)
Disclaimer: This article is for market information purposes only. All content and views are for reference only and do not constitute investment advice. They do not represent the views and positions of BlockTempo. Investors should make their own decisions and trades. The author and BlockTempo will not bear any responsibility for direct or indirect losses resulting from investor transactions.