Unlocking the Bear Market Bottom: Is This On-Chain Indicator Your Bitcoin North Star?
In the volatile world of cryptocurrency, “buying the dip” is a strategy as tempting as it is treacherous. For those keenly searching for market turning points, a powerful on-chain indicator, rigorously tested across multiple bull and bear cycles, could serve as your ultimate guide – a “North Star” – to precisely locate the bottom of a prolonged bear market.
Introducing the Bitcoin Supply in Profit/Loss Indicator
This crucial metric, known as the “Bitcoin Supply in Profit/Loss,” offers deep insights into the aggregate financial state of Bitcoin holders. It meticulously tracks the proportion of Bitcoin supply currently held at a profit versus the amount held at an unrealized loss, often referred to as “bag-holding.”
Historical data consistently demonstrates a powerful pattern: when the “Bitcoin Supply in Profit” converges with, or even crosses, the “Bitcoin Supply in Loss” on the charts, it frequently signals that the bear market bottom is firmly in place. This convergence often marks the final stages of “capitulation selling,” opening a golden window of opportunity for long-term strategic accumulation.
The Current Landscape: A Bottoming Signal on the Horizon?
For bullish investors eagerly anticipating a market resurgence, promising news may be on the immediate horizon. Recent data indicates a compelling trend: the quantities of Bitcoin held in profit and those held at a loss are rapidly converging, hinting at an imminent “crossing.”
According to Glassnode’s latest statistics, approximately 11.1 million Bitcoins are currently held in profit, meaning their acquisition cost is below the current market price. Conversely, around 8.9 million Bitcoins are held at a loss. The shrinking disparity between these two figures, if it continues its current trajectory, could very well mirror the bottoming patterns observed in 2022 and the 2018-19 bear market cycle.
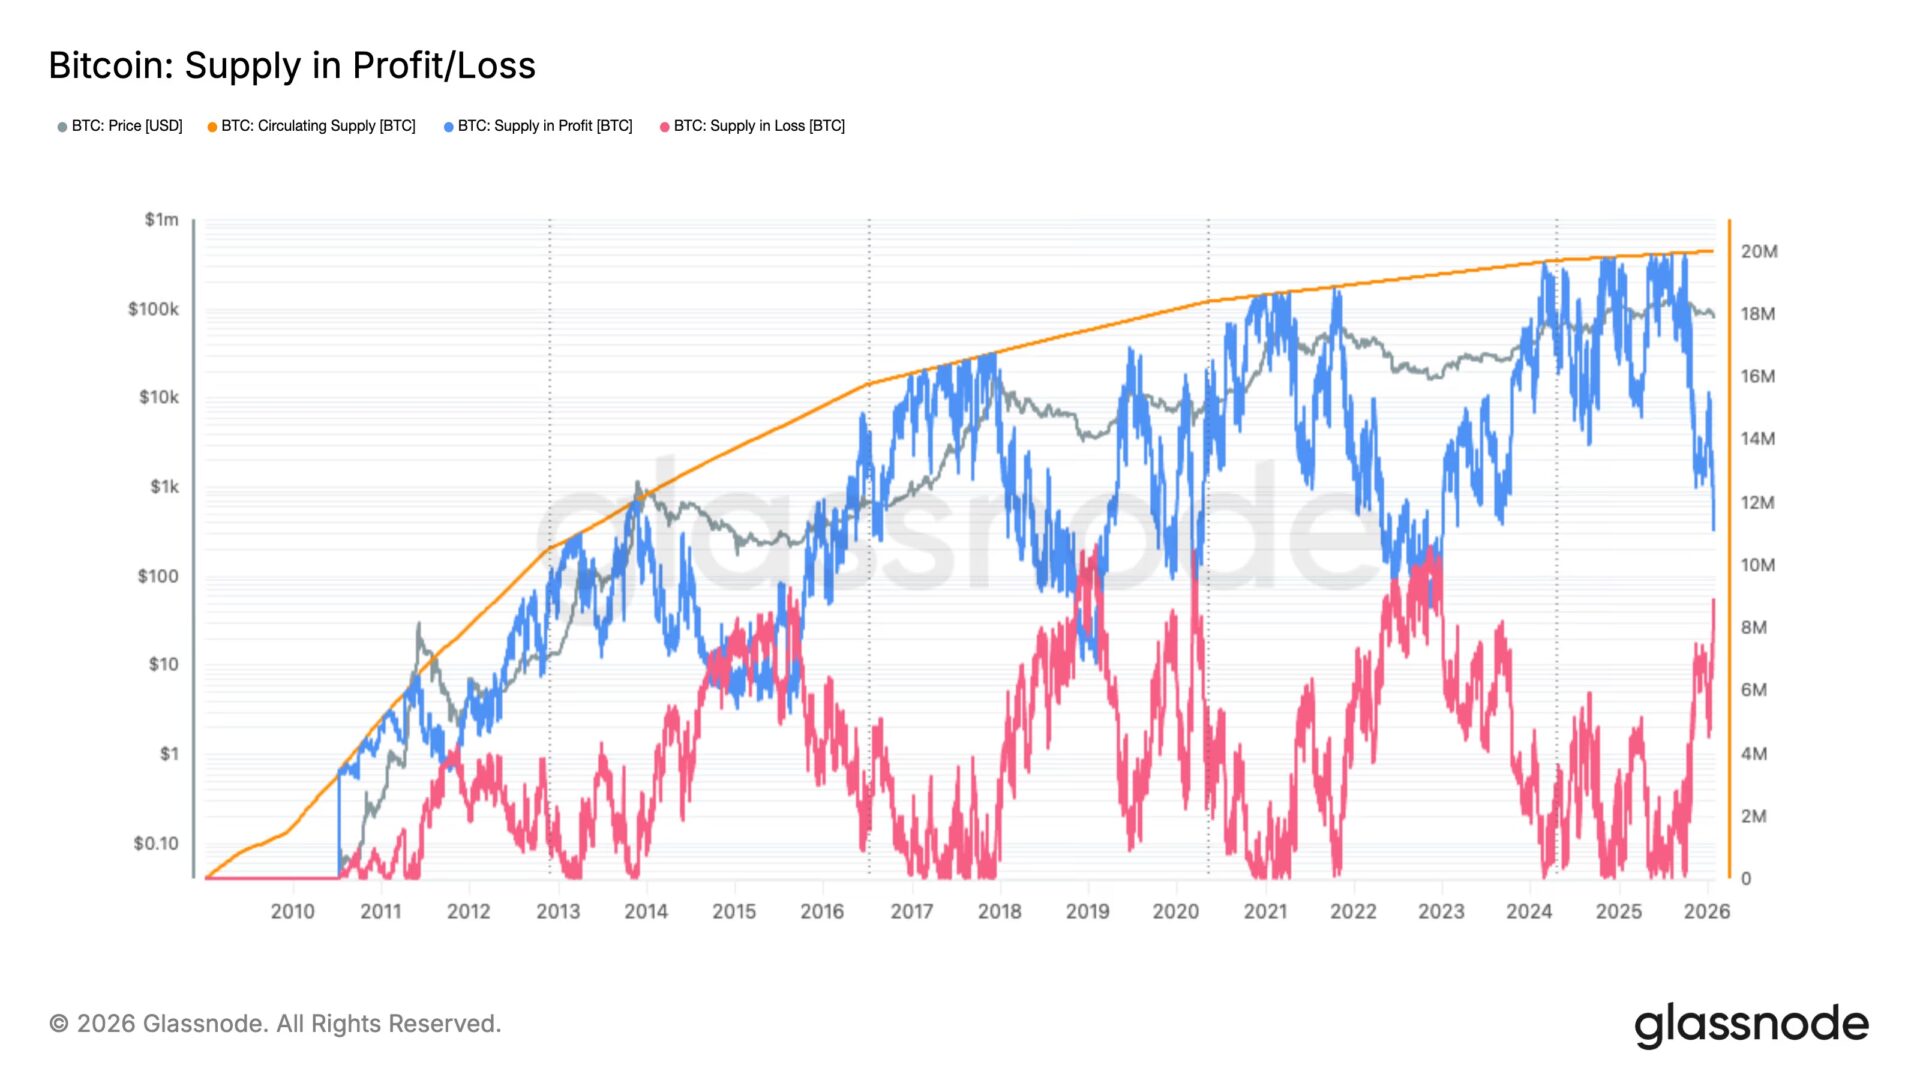
On the Glassnode analysis chart, the blue curve represents the “Supply in Profit,” while the red curve signifies the “Supply in Loss.” As Bitcoin’s spot price fluctuates, moving above or below the aggregate cost basis of investors, the supply shifts between these two states. Monitoring the ebb and flow of these curves provides invaluable clarity into the market’s holding structure and the psychological pressure points faced by investors.
Historical Accuracy: A Proven Track Record
A review of past market cycles reveals the remarkable precision with which the “crossing point” of these two curves has pinpointed bear market bottoms:
- November 2022: Amidst the widespread panic following the FTX exchange collapse, Bitcoin plummeted to around $15,000. The indicator registered a cross, accurately preceding a significant market bottom and subsequent rebound.
- March 2020: The global liquidity crisis triggered by the COVID-19 pandemic saw Bitcoin briefly dip below $3,000. This indicator once again flashed a powerful bottoming signal.
- January 2019: During the depths of a prolonged bear market winter, Bitcoin reached approximately $3,300. The indicator provided crucial confirmation of the market floor.
- 2015: Even in earlier market cycles, a similar structural convergence was observed when Bitcoin was trading above $200, marking another significant bottom.
Anticipating the Next Golden Cross
As the gap between profitable and loss-making Bitcoin supply continues to narrow, investors worldwide are holding their breath, eagerly awaiting the next “golden cross” moment. The critical question now remains: will history once again repeat itself, offering a clear signal for the next major market turning point?
Disclaimer: This article is for informational purposes only. All content and views expressed herein are for reference only and do not constitute investment advice. They do not represent the views or positions of the author or BlockTempo. Investors should conduct their own research and make their own trading decisions. The author and BlockTempo shall not be held responsible for any direct or indirect losses incurred by investors as a result of their trading activities.