

Crypto Market Plunge: Unpacking the $2 Billion Liquidation and Macroeconomic Headwinds
The first week of November witnessed a stark shift in crypto market sentiment, plunging into a deep state of pessimism as Bitcoin (BTC) and Ethereum (ETH) experienced significant price corrections.
Bitcoin breached the lows established during the “10.11” market crash, failing to hold the critical $100,000 psychological barrier and even dipping below $99,000 – marking a new six-month low. Ethereum, similarly, touched the $3,000 mark, reflecting the broader market weakness.
The ensuing volatility triggered a cascade of liquidations, with over $2 billion in positions wiped out across the network within a 24-hour period. Long positions bore the brunt of this downturn, accounting for $1.63 billion in losses, while short positions saw $400 million liquidated.
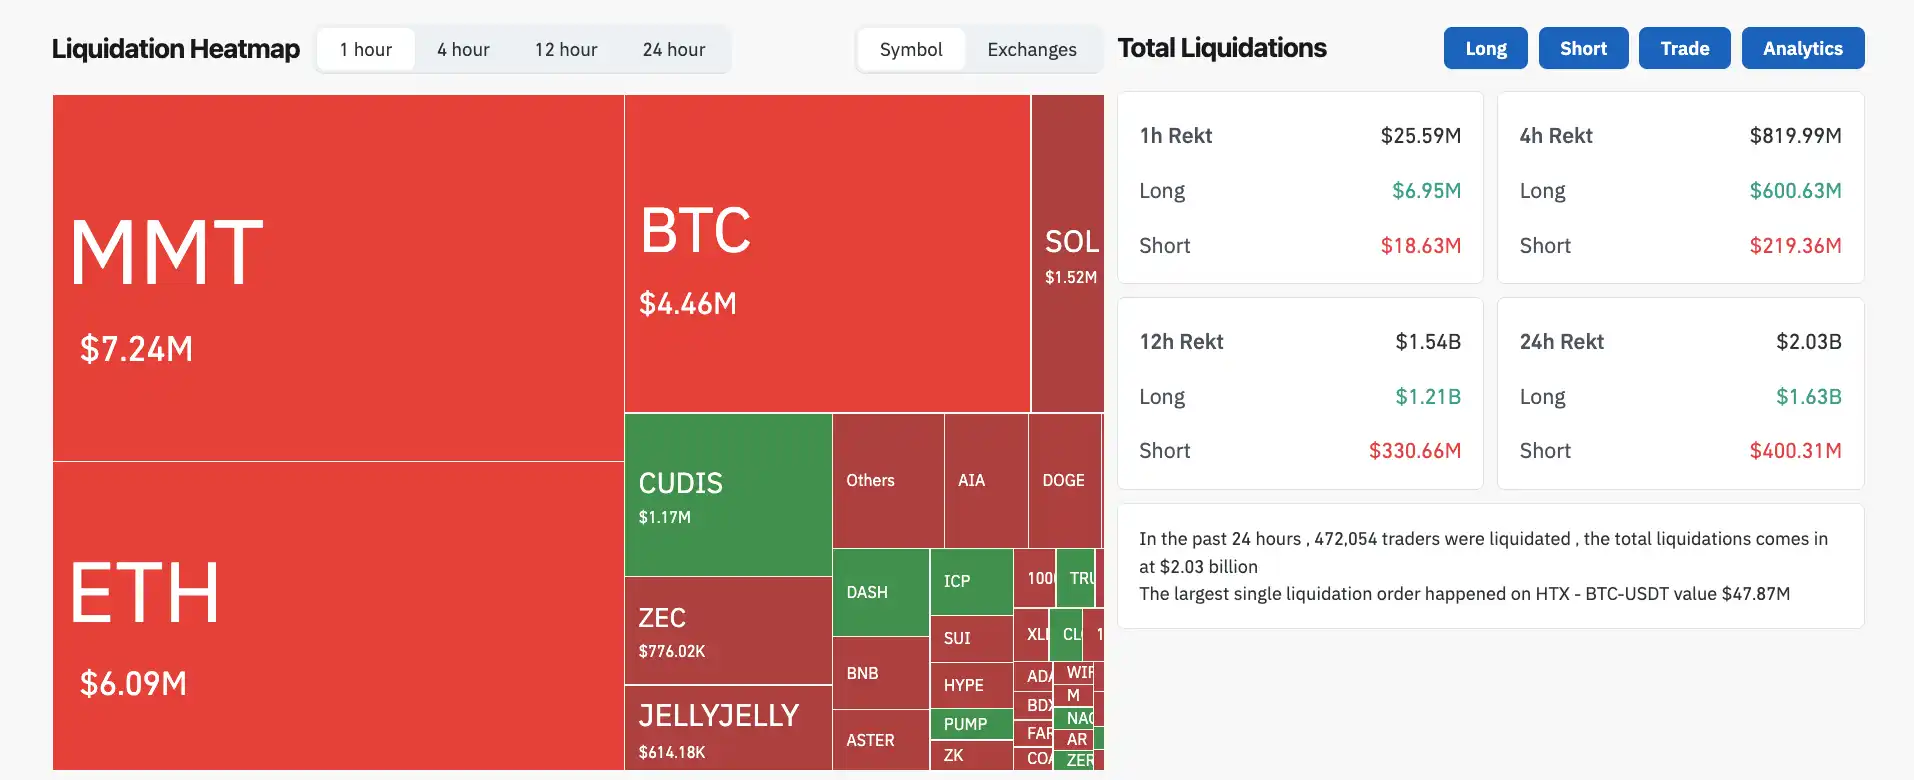
The most severe single incident of the downturn was a BTC-USDT long position on the HTX trading platform, which suffered a staggering $47.87 million liquidation, topping the global liquidation charts and highlighting the extreme leverage prevalent in the market.
While the downturn might seem sudden, a closer look reveals a confluence of factors at play, both internal to the crypto industry and from the broader macroeconomic landscape.
Internal Industry Shocks
The crypto industry faced a double blow from internal project incidents, further eroding investor confidence:
- Balancer Exploit: On November 3rd, Balancer, a well-established DeFi protocol and a foundational infrastructure project even predating Uniswap, was exploited for $116 million due to a code vulnerability. Such a significant security breach in a core decentralized finance component sent shockwaves through the sector, raising concerns about protocol security.
- Stream Finance Collapse: The following day, November 4th, the wealth management platform Stream Finance collapsed, reporting $93 million in losses. The exact cause of the loss remains undisclosed by the platform, leading the community to speculate it may have been linked to the “10.11” market crash.
These two incidents alone collectively wiped out an additional $200 million from an already strained crypto market, underscoring the fragility within certain segments of the digital asset ecosystem.
Macroeconomic Headwinds
Beyond internal crypto issues, broader macroeconomic headwinds played a significant role in the market’s decline:
- Global Market Downturn: November 4th saw a global market downturn, with even previously soaring Japanese and Korean equities experiencing declines, alongside a dip in U.S. pre-market trading, indicating a widespread risk-off sentiment.
- Fed Rate Cut Uncertainty: A primary concern was the Federal Reserve’s stance on interest rates. Following the Fed’s remarks last Wednesday, the likelihood of a December rate cut diminished, with signals suggesting no immediate urgency to ease monetary policy. This dashed hopes for easier liquidity conditions.
- ETF Net Outflows: Bitcoin ETFs experienced substantial net outflows, with U.S. Bitcoin ETFs seeing $802 million in net outflows last week, followed by an additional $180 million on Monday, November 3rd.
- U.S. Tariff Trial: Adding to the uncertainty, November 5th marked the U.S. Supreme Court’s oral arguments for a “tariff trial,” examining the legality of former President Trump’s global tariffs. A ruling against Trump could lead to tariff cancellations and subsequent policy adjustments, injecting further unpredictability into global trade.
- Government Shutdown Impact: The U.S. federal government shutdown, entering its 35th day and matching the longest on record, forced institutions to hedge against high-risk assets, contributing significantly to the market sell-off. This government paralysis is considered a core driver of the recent downturn.
Previous analyses by Wall Street Insights highlighted that the shutdown compelled the U.S. Treasury to dramatically increase its General Account (TGA) balance at the Federal Reserve from approximately $300 billion to over $1 trillion within three months, a five-year high. This action effectively withdrew over $700 billion in cash from the market.
Such a massive liquidity drain had a tightening effect comparable to multiple interest rate hikes. Key funding rate indicators flashed red, with the Secured Overnight Financing Rate (SOFR) surging 22 basis points on October 31st, well above the Fed’s target range, indicating that actual market funding costs were not declining despite the Fed’s stance. Concurrently, the use of the Fed’s Standing Repo Facility (SRF) neared historical highs.
Spot ETF Bloodletting Accelerates
The outflows from spot Bitcoin ETFs proved even more severe than initially anticipated, signaling a significant shift in institutional sentiment.
Between October 29th and November 3rd, BlackRock’s IBIT, the world’s largest spot Bitcoin ETF holding 45% of the market share, experienced a cumulative net outflow of $715 million over four trading days. This alone accounted for more than half of the total $1.34 billion net outflow from the entire U.S. Bitcoin ETF market.
Over the entire week, from October 28th to November 3rd, IBIT’s net outflow totaled $403 million, representing 50.4% of the market’s $799 million total. A single day, October 31st, saw an outflow of $149 million, setting a new industry record for the highest single-day outflow.
On November 4th, BlackRock’s Coinbase Prime custody address also executed on-chain adjustments involving 2,043 BTC and 22,681 ETH. Market observers speculate this indicates continued selling of crypto assets by ETF holders, further contributing to the negative pressure.
While IBIT’s assets under management (AUM) still hover between $950 million and $100 billion, holding approximately 800,000 Bitcoin (3.8% of total circulating supply), the four-day outflow of roughly 5,800 BTC represents 0.7% of its holdings. Although this percentage might seem modest, its significance is amplified by IBIT’s position as an industry leader, creating a noticeable ripple effect across the market.
Examining other major spot Bitcoin ETFs, the top five include BlackRock’s IBIT, Fidelity’s FBTC, Grayscale’s GBTC, Bitwise’s BITB, and the ARK 21Shares ARKB.
Fidelity’s FBTC saw a net outflow of $180 million over the same period, representing a moderate 0.7% of its total size. Grayscale’s GBTC, which had seen redemptions slow after its fee reduction, still recorded $97 million in outflows this week. Smaller ETFs like BITB and ARKB experienced weekly changes around the $50 million mark.
Fundamentally, this wave of redemptions reflects a sharp decline in investor risk appetite, coinciding with broader macroeconomic expectations of high interest rates and a technical breakdown in Bitcoin’s price structure.
Long-Term Holders Also Cashing Out Aggressively
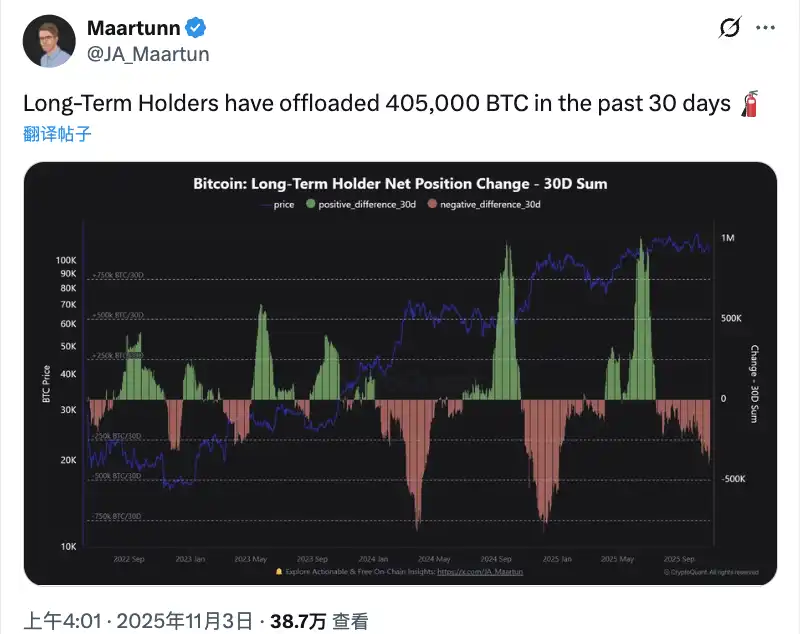
Even more impactful than ETF outflows was the aggressive profit-taking by long-term Bitcoin holders (LTHs) on-chain, indicating a significant shift in the behavior of experienced market participants.
Over the past 30 days (October 5th to November 4th), addresses classified as ‘long-term holders’ (LTHs) – those holding Bitcoin for over 155 days – cumulatively net sold approximately 405,000 BTC. This represents 2% of the circulating supply and, based on an average price of $105,000 during the period, amounts to over $42 billion in realized profits.
These LTHs still command a significant portion of the market, holding between 14.4 million and 14.6 million BTC, or 74% of the total circulating supply. Their selling behavior closely mirrored price movements: profit-taking accelerated after Bitcoin hit a new high of $126,000 on October 6th; a staggering 52,000 BTC flowed out on the day of the “10.11” flash crash; and following the four consecutive days of ETF net outflows from late October to early November, an average of over 18,000 BTC was sold daily.
On-chain data further reveals that the primary sellers were “middle-generation” wallets holding between 10 and 1,000 BTC – investors who purchased 6 to 12 months ago and were sitting on approximately 150% in unrealized gains. Interestingly, large whales, holding over 1,000 BTC, showed slight accumulation, suggesting that top-tier investors remain un-bearish, with the selling pressure largely coming from medium-sized profit-takers.
Historically, LTHs sold 5.05% of their holdings in March 2024, leading to a 16% drop in Bitcoin. In December of the previous year, a 5.2% sell-off resulted in a 21% decline. This October’s 2.2% sell-off, which only saw a 4% price drop, appears relatively mild in comparison.
However, the combined force of simultaneous outflows from both ETFs and on-chain long-term holders created an insurmountable selling pressure that the market could not withstand, leading to the sharp correction.
Expert Perspectives on a Potential Bottom
As the market seeks stability, various analysts offer their insights into potential support levels:
- Glassnode’s Analysis: Glassnode’s market analysis indicates that the market is struggling to remain above the short-term holder cost basis (approximately $113,000), a critical juncture for both bullish and bearish momentum. Failure to reclaim this level could lead to a further retreat towards the active investor realized price (around $88,000).
- CryptoQuant’s View: Ki Young Ju, CEO of CryptoQuant, shared on-chain data revealing that the average cost basis for Bitcoin wallets is $55,900, implying an average profit of approximately 93% for holders. Despite strong on-chain fund inflows, he noted that price appreciation is hampered by weak demand.
- 10x Research’s Prediction: Following the market decline, Markus Thielen, CEO of 10x Research, stated that Bitcoin is nearing the support line established since the October 10th crash. A breach below $107,000 could see it test the $100,000 level.
- Ban Muxia’s Long-Term Outlook: Prominent Chinese crypto KOL Ban Muxia publicly declared today that “the traditional 4-year cycle bull market has ended.” He predicts Bitcoin will gradually fall to $84,000, followed by several months of complex consolidation, before surging to $240,000 by late next year or early the following year, mirroring a potential U.S. stock market bubble.
The only silver lining amidst this bearish sentiment, for now, is the historical trend: November has, on average, been a positive month for Bitcoin.
This article is an authorized excerpt and reprint from our partner PANews. Original Link | Source: Blockbeats
Disclaimer: This article is intended for market information purposes only. All content and views are for reference and do not constitute investment advice. They do not represent the views or positions of Blockbeats. Investors should exercise their own judgment and make independent trading decisions. Neither the author nor Blockbeats will bear any responsibility for direct or indirect losses incurred by investor transactions.