

Author: David, TechFlow
US Government Shutdown Ends: What History Tells Us About Market Reactions for Stocks, Gold, and Bitcoin
At 5 AM on November 13, a significant chapter in American political history closed as a record-setting 43-day government shutdown crisis finally drew to an end. The US House of Representatives, in a decisive 222-209 vote on the evening of November 12, passed a temporary appropriations bill, subsequently signed by President Trump, officially concluding the stalemate that began on October 1.
The past 43 days cast a long shadow over the world’s largest economy. Widespread flight delays, disruptions to vital food assistance programs, and a halt in the release of critical economic data fueled an atmosphere of pervasive uncertainty. Now, as the federal government reopens its doors, a pivotal question looms: How will financial markets respond?
For investors navigating both traditional and cryptocurrency markets, this moment transcends mere political resolution. It offers a unique “experiment window” to observe how asset prices react to the sudden dissipation of uncertainty. Historical precedents suggest that major US government shutdowns have consistently triggered distinct patterns in US stocks, gold, and Bitcoin.
As federal funds resume flow and agencies return to full operation, which assets are poised to benefit? For a quick overview, refer to the accompanying infographic:
Below, we delve into the historical data, providing detailed insights to empower you as a more informed investor.
Understanding the Investment Impact of Government Shutdowns
To truly grasp the market’s post-shutdown behavior, we must first dissect how these governmental stoppages influence asset prices. A government shutdown is far more complex than a mere “public holiday” for federal employees.
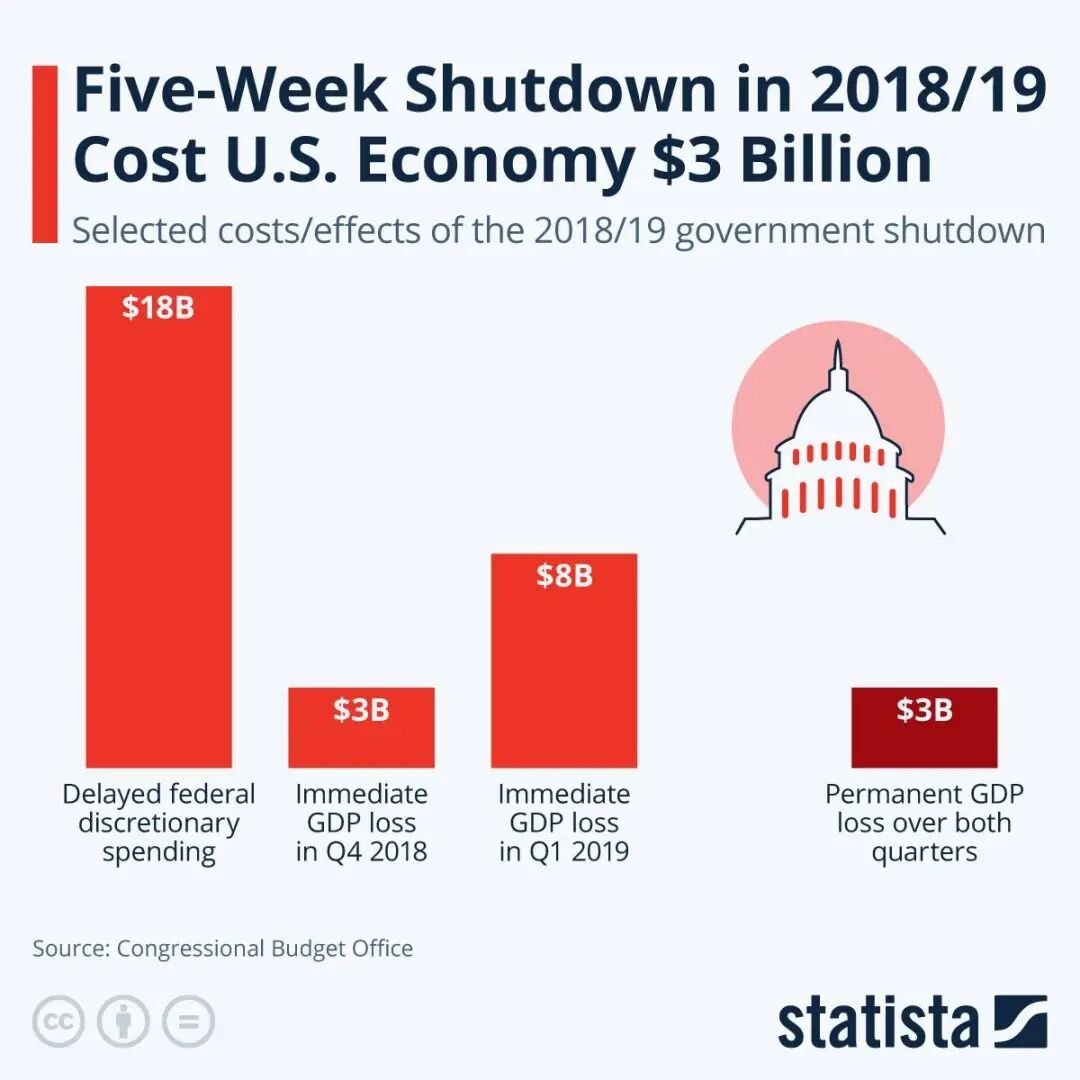
The Congressional Budget Office (CBO) estimated that the 35-day shutdown in 2018-2019 resulted in approximately $3 billion in permanent GDP loss and an additional $8 billion in delayed economic activity. This recent 43-day crisis, the longest in US history, is expected to incur even greater economic costs, though the CBO’s official assessment is still pending, considering its extended duration and broader impact.
Beyond the tangible reduction in economic activity—reflected in GDP growth, consumer spending, and corporate earnings—the paramount factor influencing markets is the inherent *uncertainty*.
A fundamental principle of financial markets is investors’ aversion to unpredictability. When the future appears opaque, capital typically shifts away from high-risk assets (like tech and growth stocks) towards safe havens (such as gold and US Treasuries), often accompanied by reduced leverage and increased cash holdings.
Conversely, the cessation of a shutdown theoretically ushers in:
- Restored Policy Certainty: Government funding is secured, at least for the immediate future.
- Resumption of Economic Data: Investors regain essential tools for fundamental analysis.
- Restart of Fiscal Spending: Delayed procurements, salaries, and benefits inject a short-term boost into the economy.
- Improved Risk Appetite: The removal of a worst-case scenario encourages capital to seek higher returns.
This often culminates in a “relief rally,” as the mere elimination of uncertainty acts as a positive catalyst. However, the sustainability of such a rebound is crucial to evaluate.
Post-shutdown, markets quickly pivot back to scrutinizing underlying economic fundamentals. Therefore, we categorize the market impact into two phases:
- Short-term (1-2 weeks): Driven by emotional repair and the removal of uncertainty, typically favoring risk assets.
- Mid-term (1-3 months): Dependent on the actual health of economic fundamentals and prevailing macroeconomic factors.
For the crypto market, an additional layer of complexity exists: the return to full operation of regulatory bodies like the SEC and CFTC. These agencies largely paused activities during the shutdown, delaying approvals and enforcement actions. Their subsequent “catch-up” efforts represent a significant variable.
Let’s now examine historical data to see how US stocks, gold, and Bitcoin have performed after previous major shutdowns.
US Stock Market: A Consistent Post-Shutdown “Relief Rally”
We’ll analyze three historically significant and prolonged government shutdowns to understand how investors allocated capital in the US stock market upon government reopening.
1. December 1995 Shutdown (21 days): A Moderate Ascent Pre-Tech Bubble
On December 16, 1995, a budget dispute between the Clinton administration and the Republican-controlled Congress led to a government closure.
Market Performance:
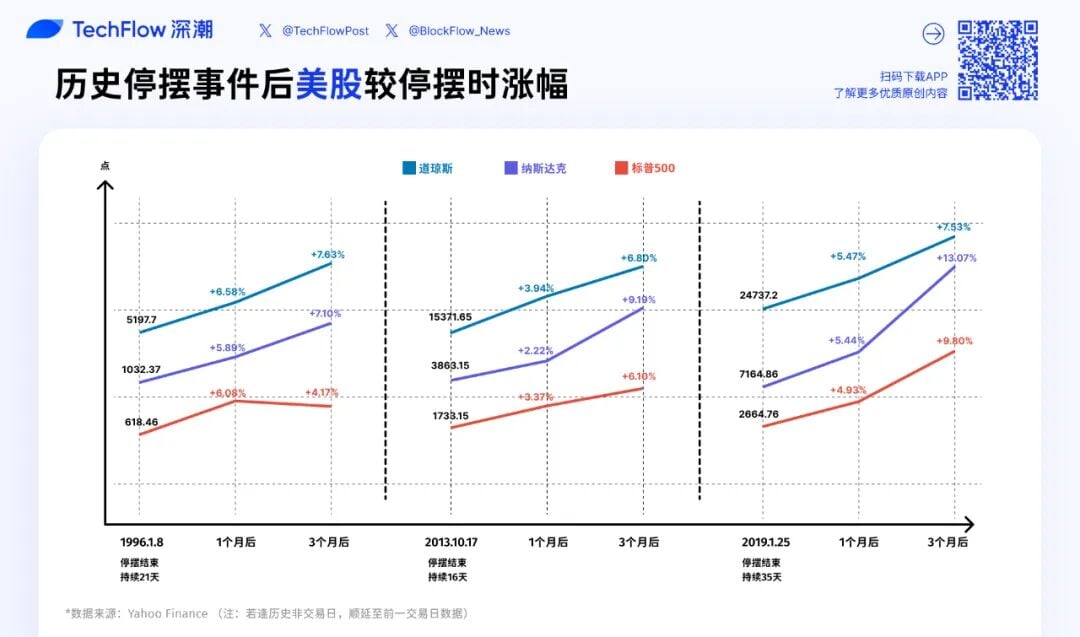
- 1 Month Post-Shutdown: S&P 500 climbed to 656.07 (+6.1%), Nasdaq to 1093.17 (+5.9%), and Dow Jones to 5539.45 (+6.6%).
- 3 Months Post-Shutdown: S&P 500 stood at 644.24 (+4.2%), Nasdaq at 1105.66 (+7.1%), and Dow Jones at 5594.37 (+7.6%).
This period saw an initial surge followed by a slight moderation. All three indices rebounded by approximately 6% within a month, but gains narrowed by the three-month mark, with the S&P 500 even receding from its one-month peak. This suggests that after an initial relief bounce, the market reverted to fundamental pricing. Occurring at the dawn of America’s “golden age” economy, with nascent tech advancements and mild inflation, the shutdown was largely a temporary blip in a long-term uptrend.
2. October 2013 Shutdown (16 days): Breaking Financial Crisis Highs
On October 1, 2013, Republicans initiated a shutdown to compel the Obama administration to delay the Affordable Care Act. The 16-day standoff concluded on October 17.
Market Performance:
- 1 Month Post-Shutdown: S&P 500 reached 1791.53 (+3.4%), Nasdaq 3949.07 (+2.2%), and Dow Jones 15976.02 (+3.9%).
- 3 Months Post-Shutdown: S&P 500 hit 1838.7 (+6.1%), Nasdaq 4218.69 (+9.2%), and Dow Jones 16417.01 (+6.8%).
This shutdown coincided with a pivotal moment: US stocks were emerging from the 2008 financial crisis and breaking through their 2007 highs. The shutdown’s end, coupled with the Federal Reserve’s ongoing QE3 quantitative easing, fostered an exceptionally optimistic market sentiment. Nasdaq’s nearly 10% gain over three months significantly outpaced traditional blue-chip stocks, underscoring tech’s leadership in the rebound.
3. December 2018 Shutdown (35 days): A Powerful Bear Market Reversal
From December 22, 2018, to January 25, 2019, a dispute over funding for a US-Mexico border wall led to the then-longest shutdown in history (35 days), only recently surpassed by the latest 43-day event.
Market Performance:
- 1 Month Post-Shutdown: S&P 500 rose to 2796.11 (+4.9%), Nasdaq 7554.46 (+5.4%), and Dow Jones 26091.95 (+5.5%).
- 3 Months Post-Shutdown: S&P 500 reached 2926.17 (+9.8%), Nasdaq 8102.01 (+13.1%), and Dow Jones 26597.05 (+7.5%).
This episode witnessed the strongest rebound among the three, driven by unique circumstances. US stocks had plummeted nearly 20% in Q4 2018 due to Fed rate hikes and trade tensions, hitting a low on December 24. The shutdown’s conclusion almost perfectly coincided with the market bottom, further propelled by the Fed’s subsequent dovish pivot and pause in rate hikes. Nasdaq’s impressive 13% gain in three months reaffirmed the high elasticity of tech stocks during periods of risk appetite recovery.
Analyzing these historical US stock market reactions reveals three clear patterns:

First, a short-term rebound is highly probable. In all three instances, the major indices saw gains of 2%-7% within one month post-shutdown, demonstrating the immediate positive impact of uncertainty removal.
Second, tech stocks often outperform. Nasdaq consistently posted stronger three-month gains (7.1%, 9.2%, and 13.1%) compared to the Dow Jones (7.6%, 6.8%, and 7.5%), indicating its higher beta during risk-on phases.
Third, mid-term performance hinges on the broader macroeconomic environment. The diverse outcomes—a quick rise and fall in 1996, sustained growth in 2013, and a powerful rally in 2019—were shaped by prevailing macro factors, not merely the shutdown’s end.
Gold’s Historical Response: Beyond the Shutdown Itself
Shifting our focus to gold reveals a narrative distinct from that of the stock market.
1. December 1995 Shutdown (21 days): Minimal Fluctuation
Gold Price Performance:
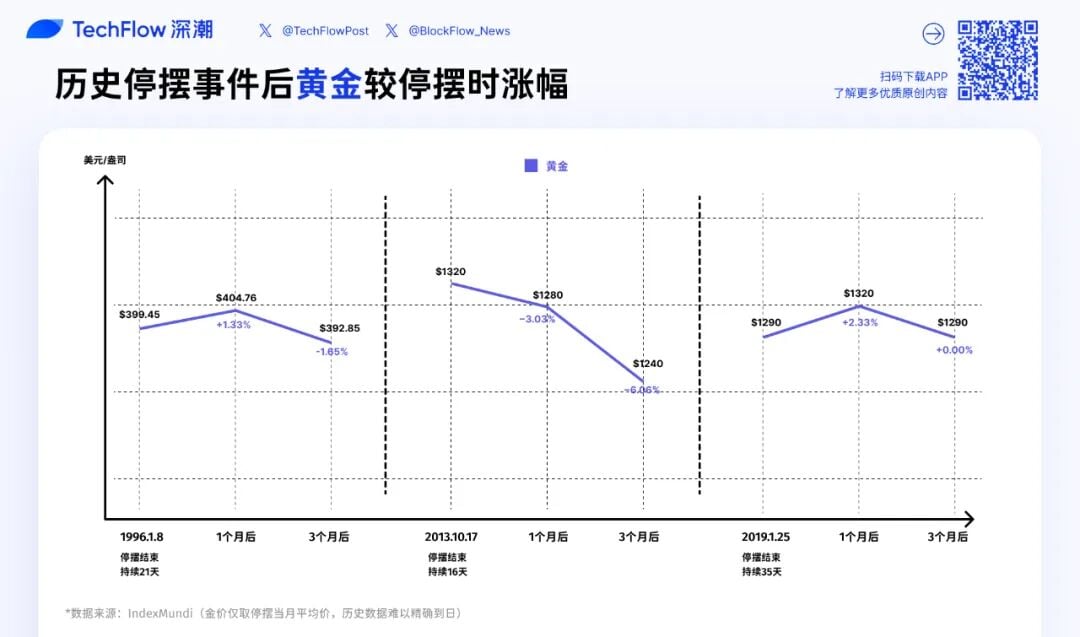
- Shutdown End (Jan 1996): $399.45/ounce
- 1 Month Post-Shutdown (Feb 1996): $404.76 (+1.3%)
- 3 Months Post-Shutdown (Apr 1996): $392.85 (-1.7%)
The political event of the shutdown had negligible impact on gold prices during this period, indicating its trend was largely unaffected by this specific event.
2. October 2013 Shutdown (16 days): Continued Decline
Gold Price Performance:
- Shutdown End (Oct 2013): $1320/ounce
- 1 Month Post-Shutdown (Nov 2013): $1280 (-3.0%)
- 3 Months Post-Shutdown (Jan 2014): $1240 (-6.1%)
This marked gold’s weakest performance among the three shutdowns. 2013 was a bear market year for gold, with prices plummeting over 25% annually. The primary drivers were the Federal Reserve’s discussions of tapering quantitative easing and a strengthening dollar, which suppressed gold. As uncertainty from the shutdown receded, gold’s safe-haven appeal diminished, accelerating its decline.
3. December 2018 Shutdown (35 days): Initial Rise, Then Retracement
Gold Price Performance:
- Shutdown End (Jan 2019): $1290/ounce
- 1 Month Post-Shutdown (Feb 2019): $1320 (+2.3%)
- 3 Months Post-Shutdown (Apr 2019): $1290 (0%)
During this shutdown, US stocks experienced a sharp downturn in late 2018, driving a surge in safe-haven demand that pushed gold from $1230 to $1290. Post-shutdown, gold briefly peaked at $1320, but as stock markets rebounded and risk appetite recovered, gold prices receded to their pre-shutdown-end levels, resulting in zero net change over three months.
In both the 2013 and 1996 shutdowns, stocks rallied 3-6% after the government reopened, while gold either declined (2013: -6.1%) or traded sideways (1996: -1.7%). This behavior aligns with the expectation that as uncertainty abates and risk appetite improves, capital tends to flow from safe-haven assets to riskier ones.
If history serves as a guide, the end of this 43-day shutdown could present two scenarios for gold:
Scenario 1: Rapid Dissipation of Safe-Haven Demand. If gold prices surged during the shutdown due to heightened risk aversion, its conclusion might trigger profit-taking, leading to a short-term correction of 5-10%. The 2013 case offers the clearest illustration of this.
Scenario 2: Persistent Macroeconomic Risks. If, despite the shutdown’s end, broader concerns such as US fiscal stability, debt ceiling issues, or recession risks linger, gold could maintain its strength or even continue its upward trajectory. After all, the shutdown’s resolution is often a temporary reprieve from deeper fiscal tensions.
Given current gold prices, the end of the shutdown may alleviate immediate safe-haven demand but is unlikely to alter gold’s long-term upward trend, which is often driven by more fundamental macroeconomic factors.
Bitcoin’s Limited History: Illuminating Insights
Finally, we address the question most pertinent to crypto investors: How will Bitcoin respond to the end of the government shutdown?
Admittedly, historical data for Bitcoin in this context is extremely limited. Bitcoin did not exist during the 1996 shutdown. During the 2013 shutdown, BTC’s market capitalization was nascent, and it was in the midst of a super bull run, making the shutdown’s influence negligible. The most relevant reference point is the 2018-2019 event.
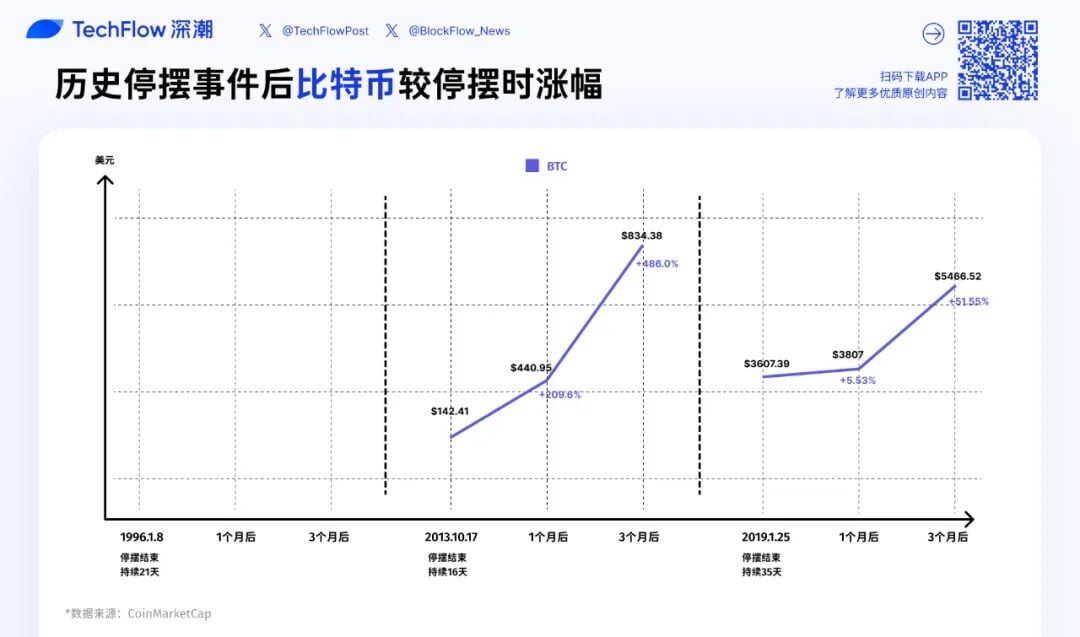
1. October 2013 Shutdown (16 days): A Bull Market Interlude, Unrelated to Shutdown
BTC Price Performance:
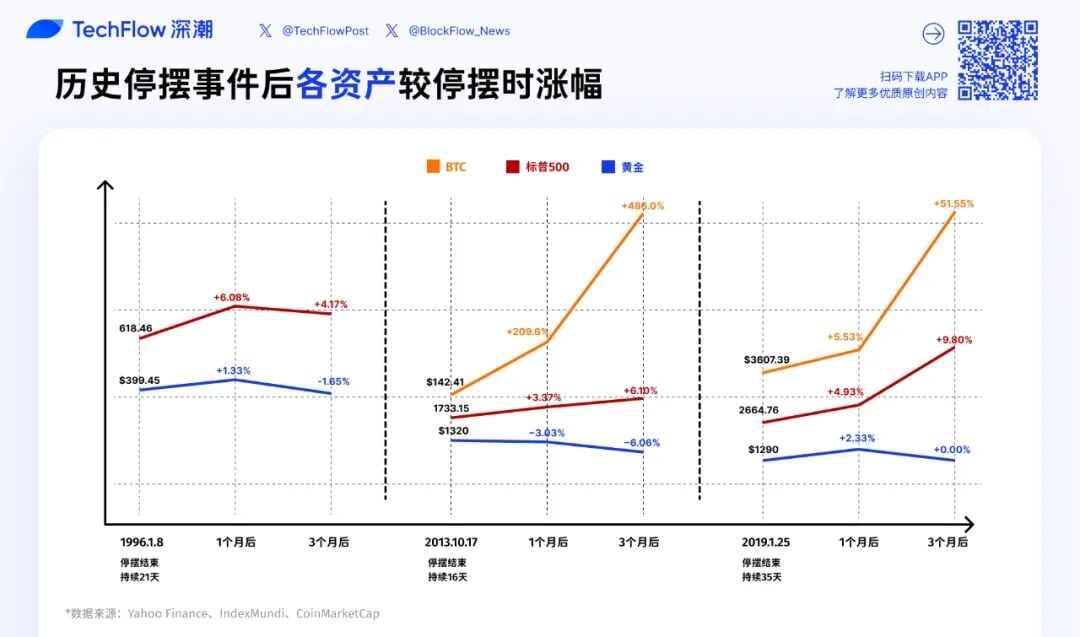
- Shutdown End (2013-10-17): $142.41
- 1 Month Post-Shutdown: $440.95 (+209.6%)
- 3 Months Post-Shutdown: $834.48 (+485.9%)
These figures appear extraordinarily dramatic, with BTC tripling in one month and nearly sextupling in three. However, 2013 was one of Bitcoin’s most explosive bull years, surging over 5,000% annually. October marked an acceleration phase, as BTC quickly rebounded from the “Silk Road” seizure and began its most aggressive ascent. The government shutdown was largely a “noise-level” event, bearing almost no causal relationship to BTC’s meteoric rise.
2. December 2018 Shutdown (35 days): Bear Market Bottom, Pivotal Turn
BTC Price Performance:
- Shutdown End (2019-01-25): $3607.39
- 1 Month Post-Shutdown: $3807 (+5.5%)
- 3 Months Post-Shutdown: $5466.52 (+51.5%)
In December 2018, BTC was languishing at the bottom of a protracted bear market, having plummeted over 80% from its December 2017 peak of $19,000 to a low of $3,122 on December 15, 2018. The shutdown’s commencement on December 22 almost perfectly coincided with BTC finding its bottom.
Within one month post-shutdown, BTC saw a modest 5.5% rebound, trailing the US stock market’s 4.9-5.5% gains. However, by the three-month mark, BTC’s surge reached an impressive 51.5%, significantly outperforming the S&P 500’s 9.8% and Nasdaq’s 13.1%.
Several critical factors contributed to this:
- BTC’s Internal Bottoming Logic: Early 2019 saw a growing consensus in the crypto market that “the worst was over,” marked by miner capitulation, retail investor exodus, and nascent institutional interest.
- Improved Macro Environment: The Federal Reserve’s dovish signals in early 2019 improved global liquidity expectations, a positive catalyst for high-risk assets like BTC.
- High Volatility: With a market cap of approximately $60 billion at the time, BTC was significantly smaller and less liquid than the stock market, leading to greater volatility. As risk appetite recovered, BTC’s elastic rebound was naturally more pronounced.
Comparing Bitcoin’s performance to gold and stocks suggests it acts as a high-beta asset influenced by both macroeconomic trends and its own internal cycles.
Short-term, BTC behaves like a high-beta risk asset. Post-shutdown, as uncertainty dissipated and risk appetite returned, BTC’s rebound (12%) was comparable to Nasdaq’s (5.4%) and significantly outpaced gold’s (2.3%) over a 1-3 month horizon. This indicates that BTC’s pricing logic aligns more closely with tech stocks than traditional safe havens.
However, mid- to long-term, BTC follows its own distinct cycles. After reaching $5,200 in April 2019, BTC continued its ascent to $13,800 by June, far exceeding traditional asset gains. This rally was largely driven by the approaching four-year halving cycle and increasing institutional adoption, rendering government shutdowns a less significant factor.
Looking ahead, how might BTC react to the end of this 43-day shutdown?
- Short-term (1-2 weeks): If the shutdown’s end triggers a “relief rally” in US stocks, BTC is highly likely to follow suit.
- Mid-term (1-3 months): The trajectory will largely depend on the broader macroeconomic environment. If the Federal Reserve maintains a supportive stance, economic data avoids significant deterioration, and no new political crises emerge, BTC could extend its gains.
However, it’s crucial to remember that the crypto market currently lacks a dominant breakthrough narrative, making it less probable for BTC’s price to be driven solely by internal factors in the short term.
Shutdown Ends, The Strategic Game Continues
The curtain has fallen on the 43-day government shutdown, but this is not an ultimate conclusion; rather, it marks the beginning of a new phase of market dynamics. History suggests that markets typically experience a short-term rebound post-shutdown, but the longevity of this rally demands a rational perspective.
When you observe a 5% market surge after the shutdown, resist the urge to FOMO. Conversely, if Bitcoin experiences a short-term pullback, avoid panic selling. Prudent investing necessitates maintaining rationality, focusing on fundamental drivers, and diligently managing risk. These core principles remain steadfast, irrespective of political disruptions.
While this particular event may pass, the ongoing strategic interplay of economic forces and policy decisions will undoubtedly continue to shape market trajectories.
(The above content is excerpted and reproduced with authorization from partner PANews, original link | Source: TechFlow)
Disclaimer: This article is for market information purposes only. All content and views are for reference only and do not constitute investment advice. It does not represent the views and positions of BlockTempo. Investors should make their own decisions and trades. The author and BlockTempo will not bear any responsibility for direct or indirect losses resulting from investor transactions.