
The recent downturn in Bitcoin’s price has undoubtedly stirred anxiety among investors. However, in the volatile world of cryptocurrency, periods of widespread loss often precede significant market reversals. A historically reliable on-chain indicator, known for accurately pinpointing Bitcoin’s “bear market bottoms,” has recently flashed a signal, suggesting that the current capitulation might be nearing its exhaustion point.
According to data meticulously tracked by Glassnode, the total Bitcoin supply currently held at an unrealized loss has officially surpassed 10 million BTC. This figure represents over half of the total circulating supply, indicating that the market may be deep within an oversold and profoundly pessimistic territory. Such a metric often serves as a strong contrarian signal, where extreme fear can pave the way for future recovery.

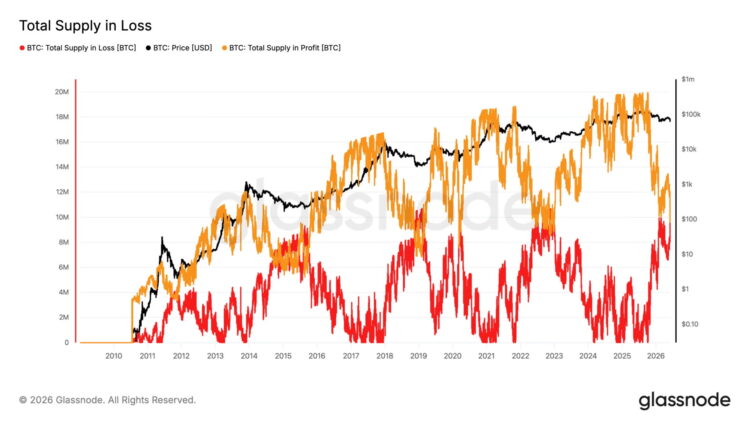
The Great Supply Flip: Loss Overtakes Profit
A closer look at granular hourly data reveals that when Bitcoin briefly dipped to $61,300 on Thursday, the volume of Bitcoin held in an unrealized loss state surged to 10.5 million BTC. Considering the global circulating supply is approximately 20 million BTC, this means more than 50% of all Bitcoin is currently underwater for its holders. Concurrently, the amount of Bitcoin held in profit has dwindled to around 9.8 million BTC. This marks a pivotal moment in the current market cycle: the first instance where the ‘loss-making supply’ has officially exceeded the ‘profit-making supply.’
Historically, such a dramatic shift in supply dynamics – where the majority of holdings are at a loss – is a hallmark of “deep bear markets.” Crucially, these periods of maximum pain often coincide with, or immediately precede, significant market bottoms, setting the stage for subsequent rallies.
Historical Precedents: Will History Repeat Itself?
To understand the potential implications of this signal, it’s insightful to examine past crypto market cycles:
- 2015 Bear Market: The battle between loss and profit-making supply persisted for nearly a year before a genuine market recovery took hold.
- 2019 Bear Market: The bottom consolidation phase was relatively shorter, lasting approximately six months.
- 2020 Pandemic Crash: The intense, panic-driven sell-off triggered by the COVID-19 pandemic saw a recovery within roughly one month.
- 2022 Bear Market: This period of sustained weakness extended for about half a year.
While this on-chain indicator consistently aligns with bear market lows, proving its value as a reference point, the duration of each bottoming phase has varied considerably. Therefore, accurately predicting how long Bitcoin will remain in this current suppressed range remains challenging.
Critical Price Levels: $60,000 and the $54,000 Realized Price
Adding further urgency to the current downtrend is Bitcoin’s recent touch of the crucial 200-week moving average (200 WMA) at approximately $61,300. This long-term trend indicator, representing Bitcoin’s average trading price over the past 200 weeks, has historically acted as a robust support line during previous bear market cycles.
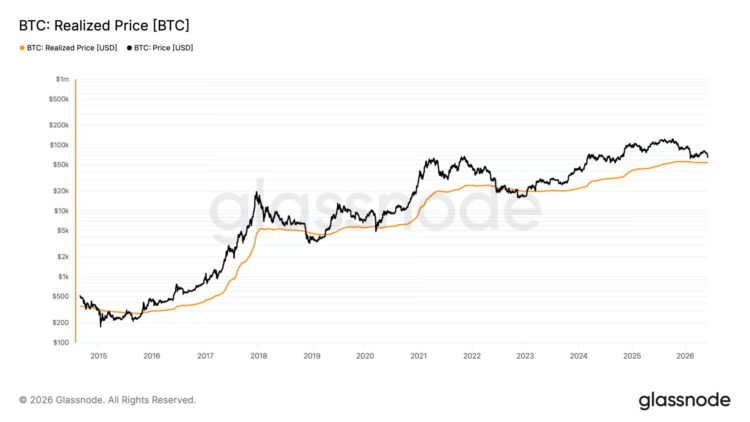
Looking ahead, if Bitcoin fails to defend the psychological $60,000 threshold, the next significant support zone is projected to be around $54,000. This isn’t an arbitrary figure; it precisely corresponds to Bitcoin’s current “Realized Price.” The Realized Price calculates the average cost basis for the entire market, based on the price at which each Bitcoin last moved on-chain. Historically, major bear markets have seen Bitcoin’s price eventually dip below its Realized Price. This suggests that $54,000 will be an absolutely critical battleground for bulls and bears in the days to come.
Disclaimer: This article is provided for market information purposes only. All content and views are for reference only, do not constitute investment advice, and do not represent the views and positions of the author or BlockBeats. Investors should make their own decisions and conduct their own trades. The author and BlockBeats will not bear any responsibility for direct or indirect losses resulting from investor transactions.