Author: CoinGecko
Compiled by: Felix, PANews

The Shifting Tides: Centralized vs. Decentralized Perpetual Futures Exchanges in 2026
The landscape of perpetual futures trading is undergoing a profound structural transformation. For years, Centralized Perpetual Futures Exchanges (Perp CEXs) have dominated the crypto market, serving as the primary liquidity conduits since BitMEX pioneered the perpetual contract model in 2016. In 2025 alone, Perp CEXs facilitated an astounding $85.3 trillion in trading volume.
However, a new wave of innovation and surging on-chain activity has propelled Decentralized Perpetual Futures Exchanges (Perp DEXs) from niche protocols into formidable competitors, challenging the established order.
Key Trends & Insights:
- The average monthly trading volume for the top 11 Perp CEXs saw a notable decline, dropping to $4.7 trillion in early 2026 from $7.1 trillion in 2025.
- Conversely, the top 12 Perp DEXs experienced robust growth, with their average monthly trading volume increasing to $611.57 billion in early 2026, up from $531.65 billion in 2025.
- The ascent of Hyperliquid fueled a breakout year for Perp DEXs in 2025, with the DEX-to-CEX trading volume ratio peaking at 13% in November 2025, though it has since seen a slight retraction in 2026.
- Perp DEXs, largely driven by Hyperliquid, rapidly expanded their Open Interest (OI) share throughout 2025, now commanding 13.5% of the total market.
1. Aggressive Expansion: MEXC and BingX Lead in Perpetual Contract Listings
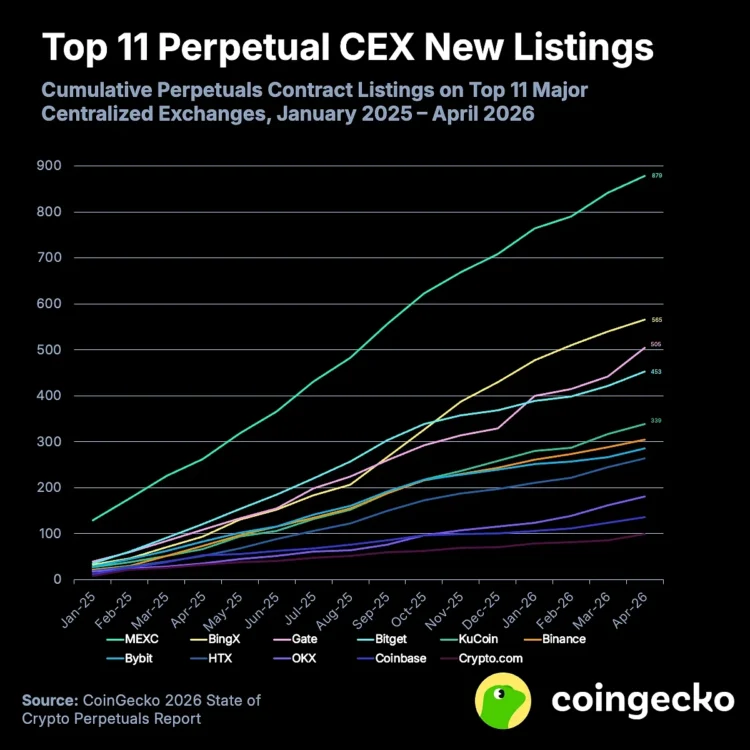
Between January 2025 and April 2026, MEXC and BingX emerged as leaders in perpetual contract listings, adding 879 and 565 new contracts respectively. This translates to an aggressive average of 55 and 35 new contracts per month, indicating a strategic focus on offering perpetuals for a broader range of long-tail crypto assets.
In contrast, six of the top 11 CEXs adopted a more conservative approach, listing fewer than 20 new perpetual contracts monthly. Crypto.com, for instance, introduced the fewest, with monthly additions ranging from 2 in December 2025 to a peak of 13 in April 2026.
Interestingly, larger exchanges frequently prioritize perpetual contract listings over spot markets. Binance, for example, added 305 perpetual contract markets over the past 16 months, compared to just 125 new spot markets, with a significant portion of these perpetuals being Memecoin and AI-related token contracts.
Conversely, exchanges like MEXC, BingX, and Gate, known for their extensive perpetual listings, have been even more proactive in spot market additions. This caters to niche risk appetites, as demand for leverage on smaller assets is generally lower.
The listing process for perpetual contracts is often more protracted due to compliance requirements and lower demand for specific contracts compared to spot trading. While CoinGecko listed 7,803 new tokens since January 2025, the top 11 CEXs added perpetual contracts for only 1,030 tokens, alongside over 200 Real-World Asset (RWA) perpetual contracts.
2. Centralized Exchanges Face Declining Trading Volumes in Early 2026
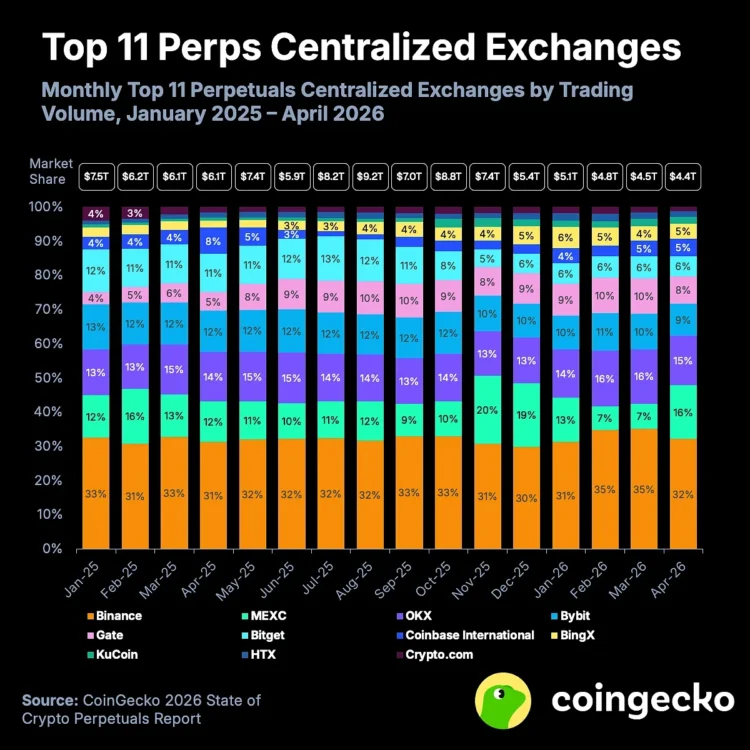
The top 11 Perp CEXs witnessed a substantial 34% drop in average monthly trading volume, falling from $7.11 trillion in 2025 to $4.69 trillion in the first four months of 2026.
Bitget experienced a particularly sharp decline in 2026, with its average monthly trading volume plummeting by 61.2% from $740.62 billion in 2025 to $287.08 billion. Despite this, it maintained a 6% market share, securing the sixth position.
Amidst this downturn, Binance and OKX continued to solidify their market dominance, registering slight increases in their trading volume shares. For the first four months of 2026, Binance commanded 33% and OKX 15% of the market, respectively.
3. CEX Open Interest Recovers Modestly, But Trading Volume Stalls
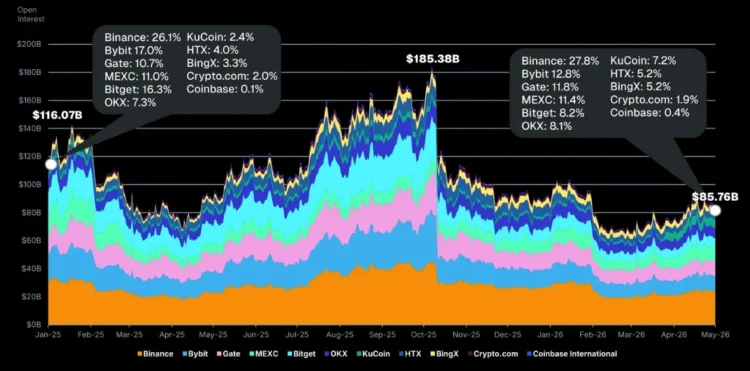
Open Interest (OI) on the top 11 Perp CEXs initially declined in Q1 2025 before surging to a peak of $185.38 billion. However, a significant drop followed the widespread liquidation event on October 10, 2025, and OI has since struggled to regain its previous highs.
The broader crypto market downturn, which saw BTC fall below $100,000, led to a further decrease in OI in early 2026. Only in recent months (March and April) have signs of recovery emerged.
As BTC rebounded from $65,000 to $80,000 throughout April, CEX Open Interest also increased, rising 12.1% from $76.52 billion at the beginning of the month to $85.76 billion by its close.
Despite this increase in OI, a corresponding growth in trading volume was not observed. Perpetual contract trading volumes for March and April stood at $4.5 trillion and $4.4 trillion, respectively, both falling short of February’s $4.8 trillion.
4. BTC and ETH Maintain Dominance Amidst Shifting Market Dynamics
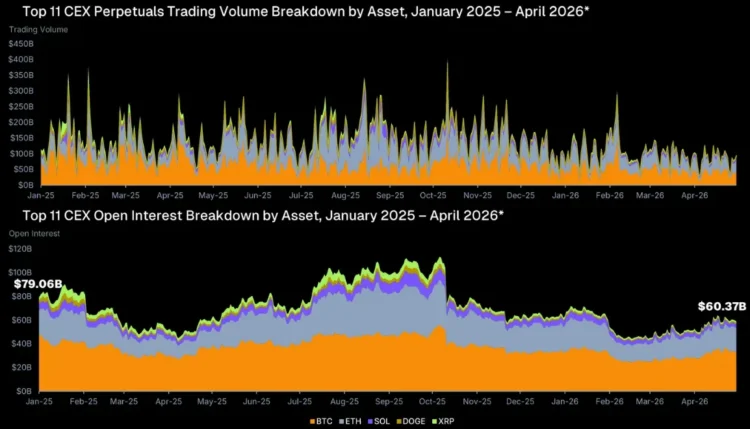
Across the top 11 CEXs, BTC has consistently driven the majority of trading volume among major cryptocurrency pairs since 2025, with an average daily trading volume reaching $69.31 billion that year. At its peak in January 2025, BTC perpetual contracts accounted for 65.3% of total trading activity.
However, BTC’s trading volume has since receded, dropping 43% from $750.9 billion in early 2025 to $428.1 billion by the end of April 2026. Its volume share also decreased to 50.2% during this period.
Conversely, ETH’s trading volume share surged from an average of 21.2% in January 2025 to 57% in August 2025, mirroring its price rally from $1,800 to $4,800. Despite this growth, ETH’s share has since fallen to 35.6% by April 2026, as BTC gradually reclaimed market share.
Collectively, the Open Interest for the top five major cryptocurrency trading pairs (BTC, ETH, SOL, DOGE, XRP) plummeted by 25.6%, from $79.1 billion to $60.4 billion. Nevertheless, these five assets still represent a significant 70.4% of the total Open Interest across the top 11 CEXs.
5. Bitcoin Funding Rates Turn Negative: A Shift in Market Sentiment
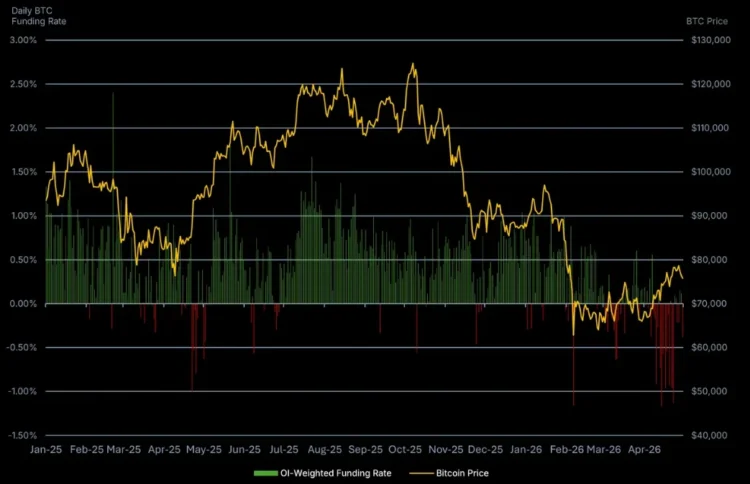
Historically, Bitcoin’s funding rate has predominantly remained positive, holding positive for 416 days (approximately 83.2% of the time) over the past 16 months. For most top CEXs, the daily funding rate typically stabilized at 0.03%, reflecting the default 0.01% fixed rate every 8 hours.
In February 2025, BTC funding rates peaked, with the composite rate hitting 2.4% just before BTC experienced its first major correction from $96,000 to $84,000. Conversely, a surge in funding rates in late May 2025 preceded BTC’s breakthrough past the $110,000 mark.
While funding rates across most top ten perpetual CEXs generally align, KuCoin and HTX have occasionally exhibited anomalous, often extreme, patterns that diverge from the overall trend. In contrast, leading CEXs like Binance and Bitget typically maintain stable funding rates consistent with their peers, showing fewer dramatic and unexpected fluctuations.
Since 2023, the composite funding rate has largely remained positive, with only brief periods of slightly negative rates. However, April 2026 marked a prolonged period of negative rates, more pronounced than previous instances, despite BTC’s recent rebound from $67,000 to $78,000. This trend reversed in May, with funding rates turning positive once more.
6. Decentralized Perpetual Exchanges Witness Surging Trading Volumes in 2026
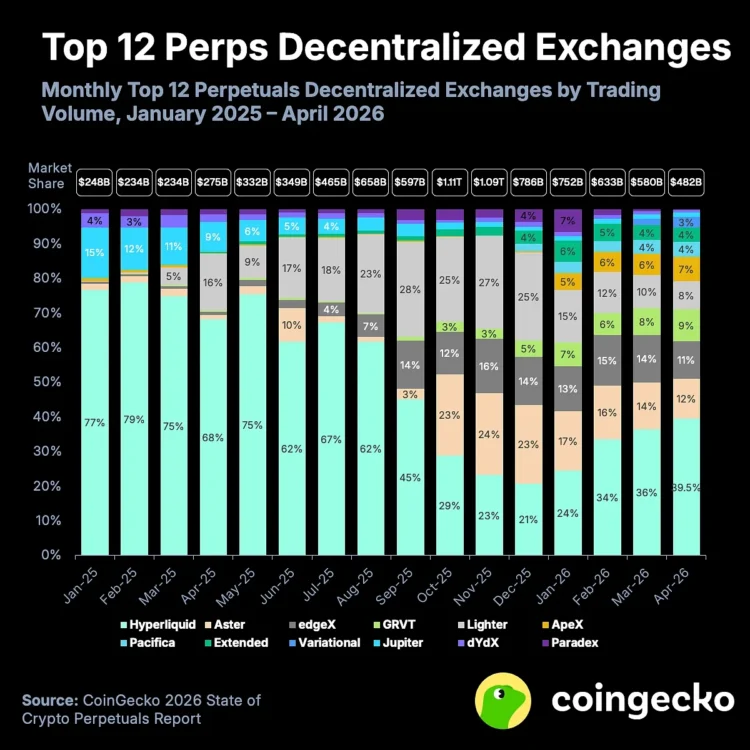
The top 12 Perp DEXs experienced a significant increase in average monthly trading volume, reaching $611.57 billion in early 2026, up from $531.65 billion in 2025. Although trading volumes started strong in January 2026 ($751.59 billion), they gradually moderated to $481.84 billion by April. Nevertheless, these figures remain substantially higher than the sub-$300 billion volumes recorded during the same period in 2025.
The year 2025 was monumental for Perp DEXs, with total trading volumes hitting $6.38 trillion, a stark increase from $1.5 trillion in 2024. Despite recent market corrections, 2026 is poised to match or even surpass 2025’s impressive volumes.
As 2026 progresses, newer Perp DEXs like Pacifica, Extended, and Variational are steadily capturing market share. Notably, all three have introduced “points programs,” hinting at potential airdrops. In April, their market shares stood at 4%, 4%, and 3% respectively, each surpassing established rivals such as Jupiter and dYdX.
7. DEX Open Interest Recovers, Hyperliquid Dominates
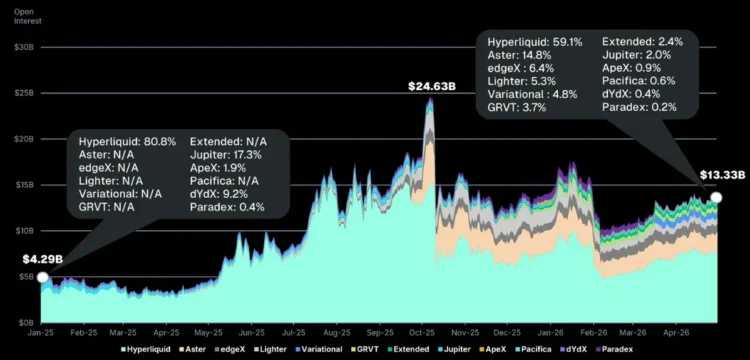
Open Interest (OI) on leading Perp DEXs demonstrated consistent growth throughout 2025, but, mirroring CEXs, it experienced a sharp decline during the October 10, 2025, liquidation event.
Similar to their centralized counterparts, DEX Open Interest showed signs of recovery in March and April, with DEXs exhibiting a slightly faster recovery pace. In April, DEX OI increased by a modest 4.7% to $13.33 billion. This figure, however, remains 46% below the all-time high of $24.63 billion recorded on October 7, 2025.
Despite Hyperliquid accounting for approximately 39% of DEX trading volume in April, it commands the vast majority of Perp DEX Open Interest, holding 59.1% (or $7.88 billion). This positions Hyperliquid as the 5th largest perpetual futures exchange overall, trailing only Binance, Bybit, Gate, and MEXC.
Aster also made a significant impact, ranking 11th overall with $1.97 billion in total OI, slightly surpassing Crypto.com’s $1.65 billion.
8. Hyperliquid Leads 61% Surge in Perp DEX Total Value Locked (TVL)
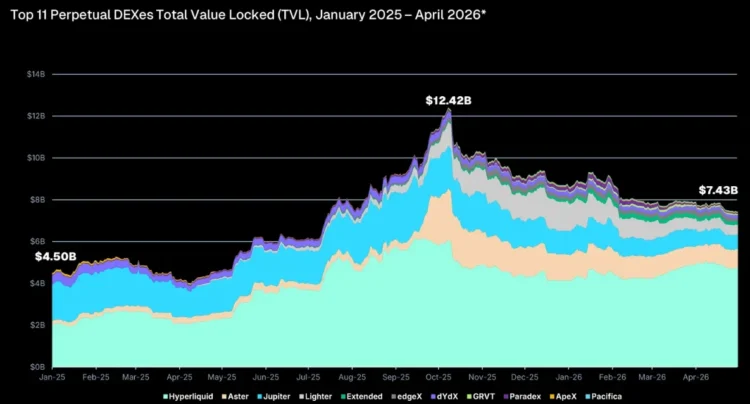
As of April 30, 2026, the aggregate Total Value Locked (TVL) across the top 11 Perp DEXs stood at $7.43 billion, representing a 61% growth since early 2025.
Perp DEX TVL steadily climbed throughout 2025, peaking at $12.42 billion in October. However, the cascading liquidation event on October 10, coupled with subsequent token price declines, led to a decrease in TVL.
The majority of this TVL is concentrated on Hyperliquid, which held $4.7 billion (63.4%) as of April 30. Hyperliquid’s market share has consistently grown throughout 2025, having started the year at 45.1%, trailing Jupiter.
Meanwhile, Jupiter’s TVL experienced a decline, partly attributable to the fall in SOL prices over the past year. From a 38.5% share ($1.7 billion) on January 1, 2025, its TVL dropped to just 9.2% ($683.3 million) by April 30, 2026.
9. Perp DEX to CEX Volume Ratio Cools After 2025 Surge
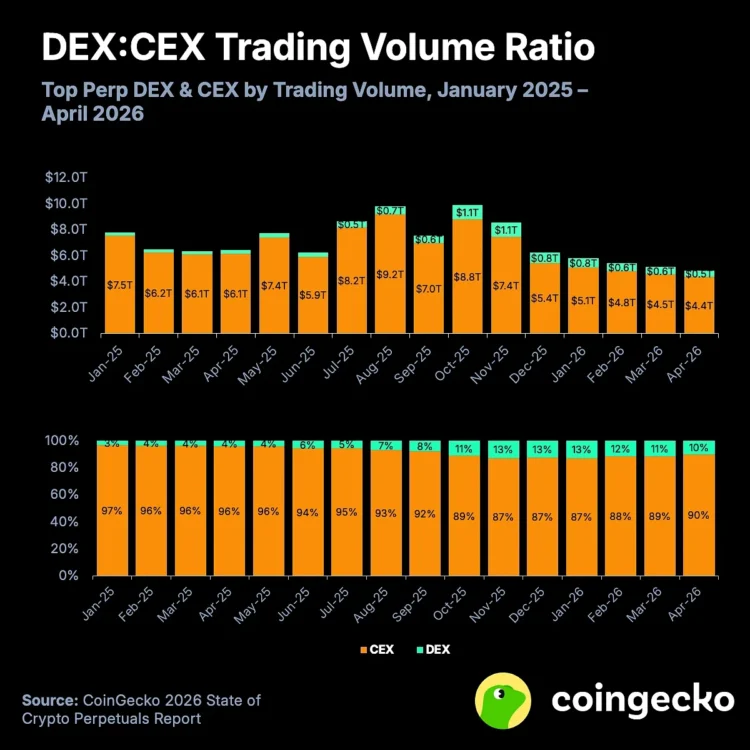
The trading volume ratio of Perp DEXs to CEXs showed continuous growth throughout 2025, escalating from a mere 3% in January to 13% by December. However, this trend has seen a slight reversal, with the ratio dropping to 10% in April 2026. This marks the first time since October 2025 that Perp CEXs have reclaimed an absolute majority, commanding over 90% of the total volume.
A significant portion of Perp DEX trading volume has gravitated towards Hyperliquid. In April, Hyperliquid alone processed $190.2 billion in trading volume, accounting for approximately 3.9% of the total volume across all perpetual futures exchanges. This placed it as the ninth-largest exchange, just behind BingX ($196.8 billion) and substantially ahead of KuCoin ($83.7 billion).
While the growth trajectory of Perp DEXs appears to be temporarily slowing, the emergence of newer platforms like Pacifica, Extended, and Variational, with their burgeoning points programs and anticipated airdrops, could potentially reignite this trend in the coming months.
10. Perp DEXs Expand OI Share, Driven by Hyperliquid and RWA Integration
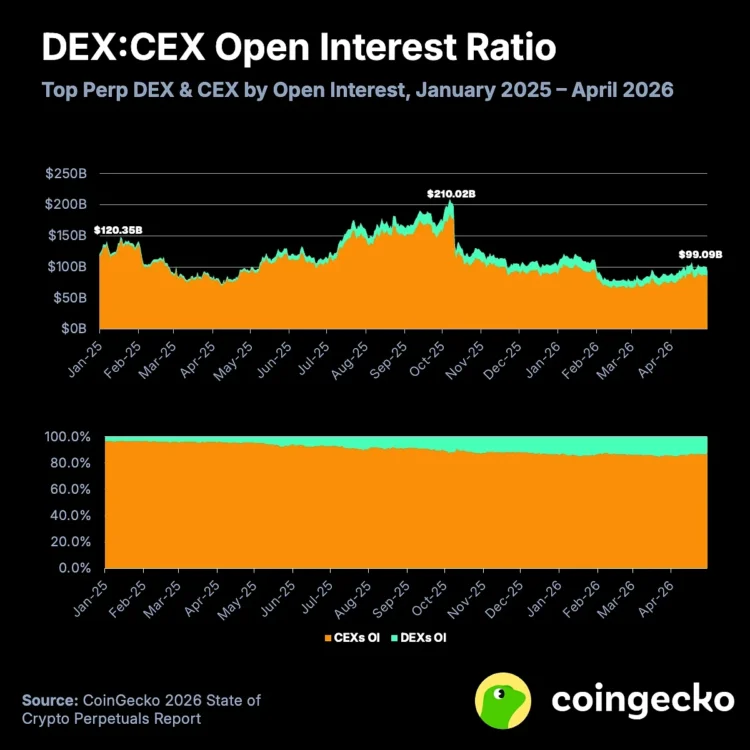
The overall cryptocurrency Open Interest (OI) has decreased from $120.35 billion at the beginning of 2025 to $99.09 billion by the end of April 2026. This represents a more than 50% decline from its peak of $210.02 billion on October 7, 2025, just before the significant liquidation event.
Predictably, CEXs continue to hold the vast majority of open positions. However, their share has diminished from 96.4% in early 2025 to 86.5% by April 30, 2026. Notably, Perp DEXs have consistently maintained an OI share exceeding 10% since early October.
The expansion of Real-World Assets (RWAs) on-chain has been a contributing factor to the rise of Perp DEXs. Amidst a buoyant stock market, crypto-native users are increasingly turning to these platforms to access Traditional Finance (TradFi) opportunities without the need to convert their crypto holdings into fiat to fund conventional securities accounts.
Recognizing this trend, Perp CEXs have also begun listing new RWA perpetual contracts, indicating a broader market shift.
11. RWA Perpetual Contracts Emerge as a Significant Trading Avenue
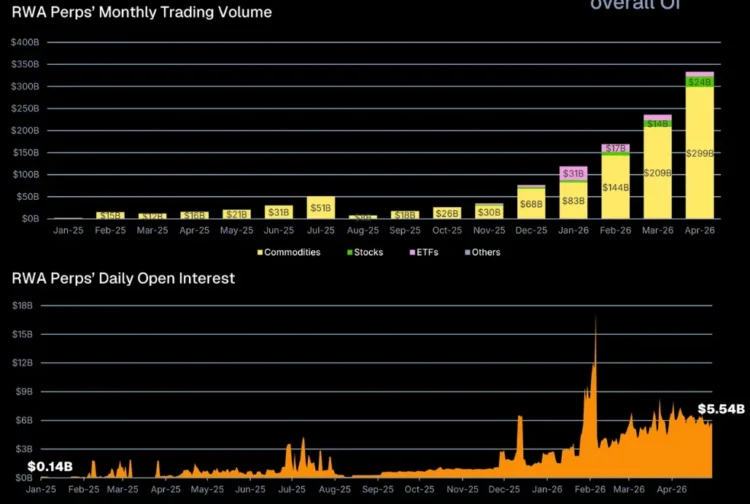
Trading activity surrounding Real-World Asset (RWA) perpetual contracts has experienced remarkable growth over the past seven months. In Q1 2026 alone, total trading volume reached $524.79 billion, a 67.7% increase over the entire $313.02 billion recorded in 2025.
April’s trading volume for RWA perpetuals hit $333.56 billion, accounting for 63.6% of the Q1 activity and marking the eighth consecutive month of volume growth.
While the average daily total Open Interest for RWA perpetual contracts climbed from $140 million on January 1, 2025, to $5.54 billion by April 30, 2026, its growth saw a slight moderation in April. The average daily OI for RWA perpetual contracts in April was $6.2 billion, an increase from March’s average of $5.6 billion.
Prior to July 2025, commodities initially dominated RWA perpetual contract trading. However, over the last six months, their share of monthly trading volume has fluctuated between 69.7% and 95.3%. This shift reflects the increasing popularity of perpetual contracts for other asset classes: with the stock market in a period of extreme enthusiasm, equity perpetual contracts have seen their market share rise from 0.4% in August 2025 to 7.1% in April 2026.
In April, RWA spot trading volume was $21.47 billion, significantly dwarfed by RWA perpetual contract volume, which was more than 15 times higher. Unlike perpetuals, the RWA spot market experienced a decline in trading volume compared to March’s $39.44 billion.
(The above content is excerpted and reproduced with authorization from our partner PANews, original link)
Disclaimer: This article is for market information purposes only. All content and views are for reference only and do not constitute investment advice. They do not represent the views and positions of BlockBeats. Investors should make their own decisions and trades. The author and BlockBeats will not bear any responsibility for direct or indirect losses resulting from investor trades.