
Bitcoin’s $48K Warning: A Historic Fibonacci Pattern Looms
Bitcoin has recently staged a notable rebound, climbing back above the $65,000 mark after dipping below $60,000. This recovery has ignited speculation across the crypto market: is the current correction finally over? However, a powerful historical pattern, observed across every Bitcoin bull and bear cycle since its inception, is flashing a significant warning. Should this pattern repeat, Bitcoin could face a more substantial downturn, potentially pushing its price towards $48,000.
Unpacking the Fibonacci Retracement Pattern
At the heart of this compelling historical observation lies the “Fibonacci retracement,” a fundamental tool in technical analysis also known as the Golden Ratio, crucial for identifying potential support and resistance levels. To visualize this pattern, one must trace Bitcoin’s journey from its near-zero origins in February 2010 (around $0.003) to the peaks of its subsequent bull markets. By connecting these pivotal points – June 2011, November 2013, December 2017, and November 2021 – a striking consistency emerges.
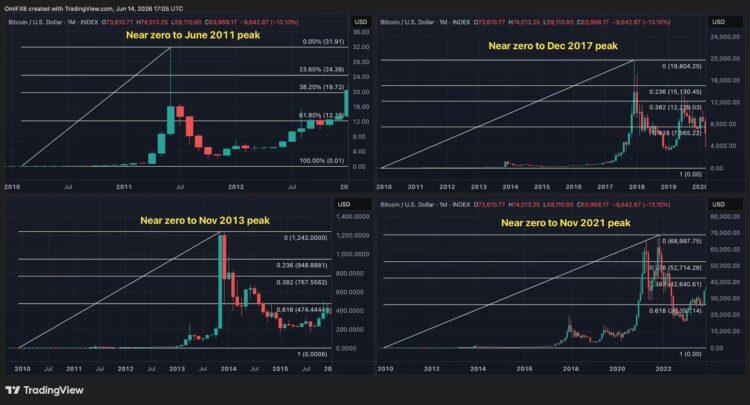
Historical data unequivocally shows that following each of Bitcoin’s four previous all-time highs and the onset of the ensuing bear markets, the cryptocurrency consistently breached a critical threshold: the 61.8% Fibonacci retracement level. Without exception, all four prolonged bear market winters concluded with Bitcoin falling below this vital support line.
Applying the Pattern to the Current Cycle
For the current cycle, the original analysis posits Bitcoin reached a new all-time high exceeding $126,000 earlier this year. Applying the Fibonacci retracement from its near-zero price in early 2010 to this calculated peak, the crucial 61.8% retracement level emerges at approximately $48,215.
Currently, Bitcoin is fluctuating around $65,000, still a considerable distance from this potential target. This implies that the historical pattern has not yet been triggered in the current cycle. However, should the market ultimately mirror the trajectory of the preceding four cycles, technical analysis points to approximately $48,000 as the next significant support zone.
The Evolving Bitcoin Landscape: Will History Repeat or Break?
It is crucial to remember that technical analysis, while powerful, is not an infallible prophecy. Even with a perfect track record across four cycles, this relatively small sample size cannot guarantee future repetition.
Furthermore, today’s Bitcoin market is fundamentally different from previous eras. The introduction of Bitcoin spot ETFs, the influx of substantial institutional capital, the rise of professional trading firms, and the maturation of the derivatives market have all contributed to a market structure that is significantly deeper, more liquid, and more efficient than ever before.
These new participants and capital inflows could potentially establish fresh support ranges before prices descend further, thereby rewriting the script of past bull and bear cycles.
Nevertheless, from a purely historical data perspective, this technical pattern remains unvalidated in the current cycle. As Bitcoin continues to trade above the 61.8% retracement level, the market will intently watch: will history repeat itself once more, or is this the cycle where the pattern finally breaks?
Disclaimer: This article is intended solely to provide market information. All content and views are for reference only and do not constitute investment advice. They do not represent the views or positions of BlockTempo. Investors should make their own decisions and conduct their own transactions. The author and BlockTempo shall not be held liable for any direct or indirect losses incurred by investors’ transactions.