

Bitcoin Whale Ratio Hits 9-Year High: Warning Signs Amidst Market Volatility
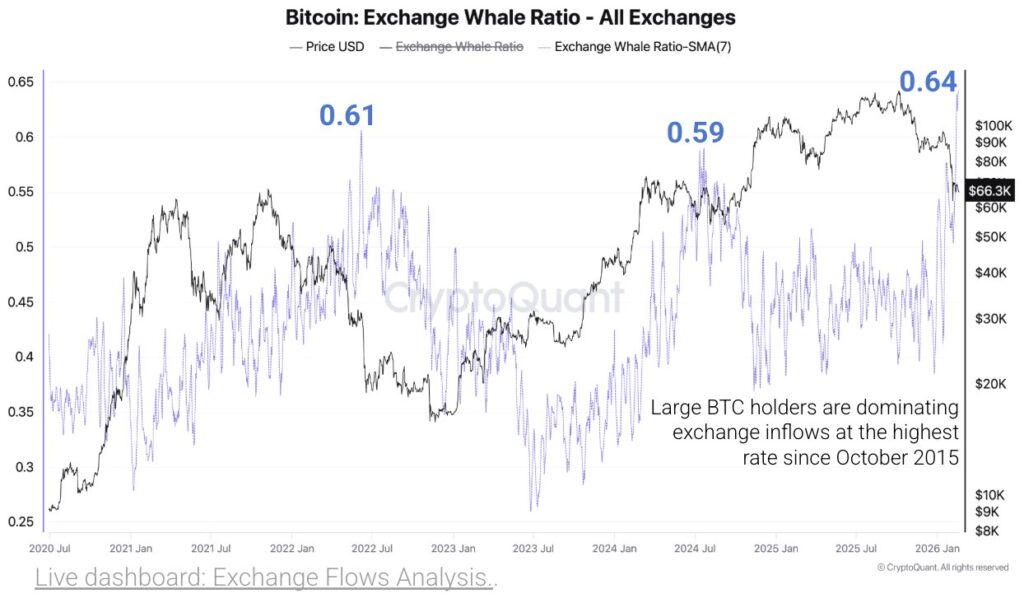
According to the latest data from CryptoQuant, the Bitcoin Exchange Whale Ratio surged to 0.64 on February 20, 2026, marking its highest level since 2015. This crucial indicator tracks the proportion of the top ten inflows relative to total exchange deposits, revealing that large holders now command 64% of all Bitcoin flowing into exchanges.
Elevated Whale Concentration Signals Potential Price Correction
This significant spike in the Exchange Whale Ratio reflects an intensified period of “whale” activity, where large volumes of Bitcoin are being deposited onto platforms like Binance. This trend is particularly pronounced during a recent correction phase, which saw Bitcoin plummet 47% from its October 2025 high of $126,080 to approximately $67,200. Such large-scale inflows, especially when liquidity is tight, could exacerbate selling pressure.
Analysts are cautioning that this heightened concentration among major holders could trigger a severe price correction. As Bitcoin endeavors to recover from its recent downturn, these whales might capitalize on limited buyer liquidity to realize profits, potentially leading to further market instability.
Binance Sees Record Whale Inflows
The indicator’s recent ascent has been particularly notable on Binance, climbing from 0.4 to 0.62 between February 2nd and 15th. Binance’s 30-day average whale inflow has reached an impressive $8.3 billion, the highest recorded since 2024. A portion of these inflows stems from early Bitcoin entities, with approximately 10,000 BTC transferred to platforms, potentially linked to “BTC OG Insider Whales” or figures like Garrett Jin. Since January 2026, Binance has recorded total inflows of around 363,000 BTC.
Historically, such elevated whale ratios have often preceded market downturns, as large players reposition their holdings amidst uncertainty. This contrasts sharply with the retail accumulation observed in early 2025. The retail-to-whale ratio has since dropped to 1.45, its lowest point since mid-2024, indicating a notable shift in buying power towards larger entities. While persistent ETF demand has continued to deplete exchange reserves (daily inflows declining from 60,000 BTC on February 6th to a recent 23,000 BTC), the reversal in whale behavior serves as an early warning of potential oversupply.
Macro Headwinds and Market Resemblances to 2025 Volatility
The current market environment adds a layer of urgency, mirroring the volatile period of 2025 when substantial whale selling coincided with institutional buying interest. The peak selling phase in 2025 witnessed significant whale distribution; while precise data for 115,000 BTC isn’t available, the overarching trend of distribution was evident. Cumulative ETF net inflows had reached approximately $53 billion, peaking near $63 billion with a strong year-end performance. However, recent ETF outflows (e.g., -$111 million on Feb 18 and -$113.9 million on Feb 17) are intensifying market pressure.
As the seasonal strength typically seen in Q4 wanes, long-term holders are also beginning to distribute their assets, exposing Bitcoin to increased volatility in a low-liquidity market. Broader macroeconomic factors, such as the Federal Reserve injecting $18.5 billion in overnight repos (the fourth largest since COVID-19) and geopolitical uncertainties like Trump’s consideration of limited strikes against Iran, further amplify market apprehension. The Fear & Greed Index has plummeted to “extreme fear” (11), and “Bitcoin is dead” searches have simultaneously peaked, underscoring the prevailing bearish sentiment.
Despite bullish ETF tailwinds helping Bitcoin’s dominance stabilize above 55%, the 0.64 whale ratio unmistakably signals a shift from holding to selling, a departure from the accumulation preference observed among whales in mid-2025. Traders are advised to closely monitor whether this ratio falls below recent highs, a pattern that has historically indicated an easing of pressure and potential rebound. However, the current elevated level warrants short-term caution against potential downside risks. Concurrently, observing a return to positive ETF net inflows, accelerated on-chain accumulation, or an improvement in macro liquidity could serve as crucial signals for a potential market turning point.
Bitcoin’s Demand Rebounds: A Glimmer of Hope?
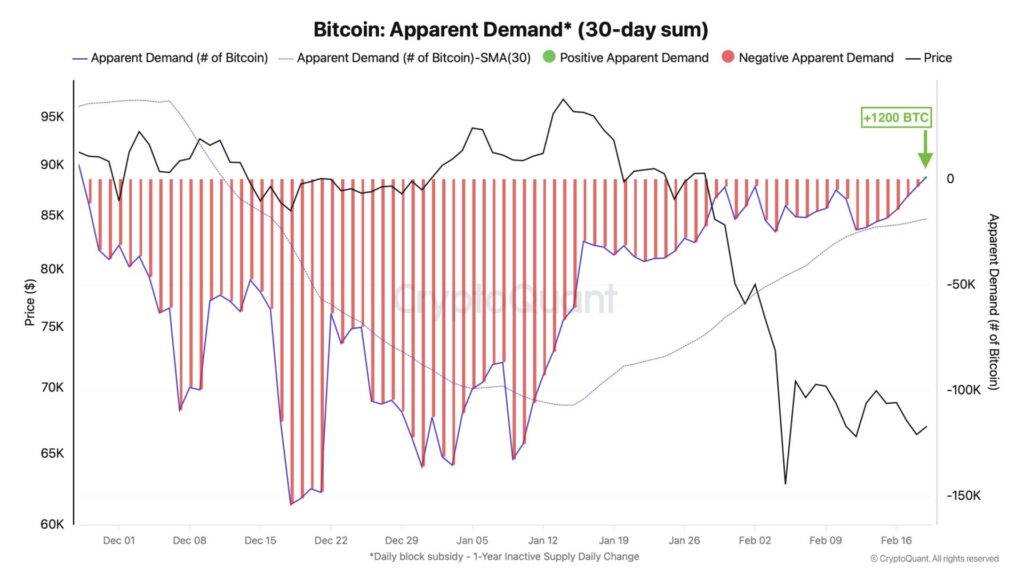
Amidst these cautionary signals, CryptoQuant analyst Darkfost offered a more optimistic perspective on February 21st, stating, “Bitcoin demand rebounds after three months of weakness, finally showing some positive signals!” He noted a gradual shift in dynamics that had previously suppressed Bitcoin demand since the beginning of the year. Specifically, after Bitcoin’s monthly accumulated apparent demand hit a low of -154,000 BTC on December 18 last year, demand has steadily improved, recently recovering to a positive range of approximately +1,200 BTC.
This reversal marks the end of nearly three consecutive months of negative demand, a period where weak demand was a primary contributor to Bitcoin’s prolonged price stagnation.
Darkfost elaborated that “apparent demand” represents the difference between the number of newly issued Bitcoins and the supply of Bitcoins that have remained uncirculated for over a year. This metric is vital for assessing whether structural accumulation is robust enough to absorb new supply. With selling pressure showing signs of abatement and demand on the rise, if this positive trend continues in the coming weeks, Bitcoin could indeed be on the cusp of more favorable signals.
Disclaimer: This article is intended for market information purposes only. All content and views are for reference only and do not constitute investment advice, nor do they represent the views and positions of the publisher. Investors should make their own decisions and conduct their own due diligence. The author and publisher will not bear any responsibility for direct or indirect losses resulting from investor transactions.