
Bitcoin is currently navigating a treacherous landscape, caught between persistent hawkish signals from the Federal Reserve, surging US bond yields, and renewed market apprehension surrounding major holders like MicroStrategy. Adding to this complex backdrop, a disquieting “bear flag” technical pattern has emerged, casting a further shadow over an already volatile market.
Bitcoin Faces Mounting Pressure as “Bear Flag” Pattern Emerges
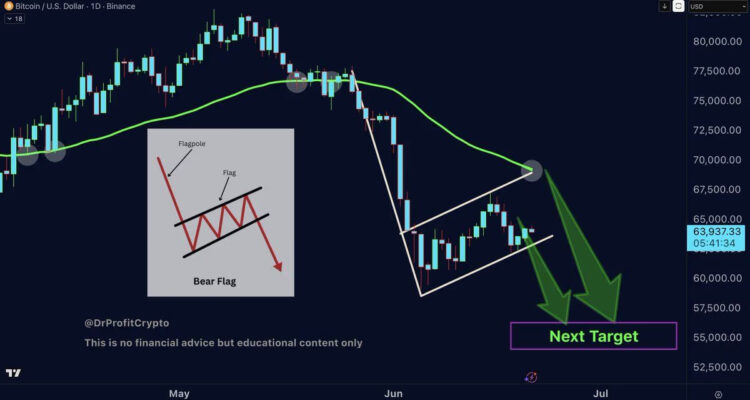
This unsettling development was highlighted by Doctor Profit, an anonymous yet highly regarded trader known for accurately predicting Bitcoin’s ascent to an all-time high of $126,000 last October, as well as the subsequent market correction. Doctor Profit recently identified a classic “bear flag” formation on Bitcoin’s daily chart, warning of potential significant downside if key support levels are breached, with prices possibly retesting the $54,000-$56,000 range, and even further declines towards $40,000-$50,000.

The Ominous “Bear Flag” Signal
Taking to the social media platform X, Doctor Profit posted: “Bitcoin is currently forming a massive Bear Flag on the daily timeframe.”
I believe Bitcoin will initially drop to the $54,000-$56,000 range, followed by a period of sideways consolidation. Subsequently, further declines are expected, with the potential bottom settling around the $40,000-$50,000 area.
A “bear flag” is a well-recognized continuation pattern in technical analysis, typically unfolding in two distinct phases. The first phase involves a sharp and rapid price decline, forming the “flagpole.” This is followed by a temporary rebound or consolidation phase, which shapes the “flag” itself. Should the price break below the lower boundary of this flag, it often signals a resurgence of selling pressure, with the subsequent decline frequently mirroring the length of the initial “flagpole.” Visually, it resembles an inverted flag, hence its name.
According to Doctor Profit’s analysis, Bitcoin’s brutal descent from its May high of $82,000 to below the $60,000 mark by June 5th — a staggering drop of over $20,000 — constitutes the “flagpole.” The subsequent rebound, which saw prices recover to approximately $68,000, is identified as forming the “flag” portion of the pattern.
Beyond Technicals: Market Sentiment and Options Data
While technical patterns offer valuable insights, they are never an exact science. Different analysts may interpret the same chart with varying trendlines and structural patterns, and a “bear flag,” despite its bearish implications, does not guarantee a downward breakout. Nevertheless, recent capital flows in the options market appear to corroborate Doctor Profit’s cautious outlook. Last week witnessed significant activity in the purchase of “put options,” with traders heavily positioning themselves around the $52,000 strike price. This surge in bearish bets underscores growing market anxiety regarding the potential for a short-term correction.
Disclaimer: This article is for informational purposes only. All content and opinions are for reference only and do not constitute investment advice, nor do they represent the views and positions of BlockBeats. Investors should make their own decisions and trades. The author and BlockBeats will not be liable for any direct or indirect losses incurred by investors’ transactions.