

Author: Nancy, PANews
Ethereum Surges Past $2,300: A Deep Dive into ETH’s Remarkable Recovery and Future Outlook
After a hiatus of over three months, the price of Ethereum (ETH) has decisively broken above the $2,300 threshold, signaling a significant shift in market sentiment and dynamics. This impressive rally is not merely a fleeting moment but a convergence of powerful internal and external forces reshaping the outlook for the world’s second-largest cryptocurrency.
Externally, a resurgence in macro risk appetite, coupled with improved regulatory clarity and a substantial short squeeze, has provided immediate momentum for ETH’s ascent. Internally, the continuous influx of capital into spot Ethereum Exchange-Traded Funds (ETFs), an acceleration in institutional allocation, and the relentless growth of ETH staking volumes are collectively bolstering market confidence and enhancing Ethereum’s medium to long-term prospects.
Ethereum’s Resurgence: Breaking the Bear Market’s ‘Golden Line’
For dedicated Ethereum enthusiasts, this powerful rebound has been a long-awaited moment. According to CoinGecko data, as of August 21, ETH’s price climbed to approximately $2,354, reclaiming levels not seen since early May of this year.
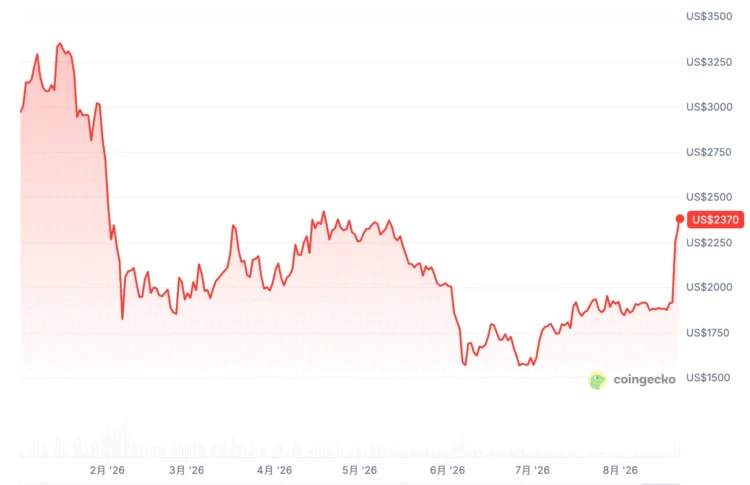
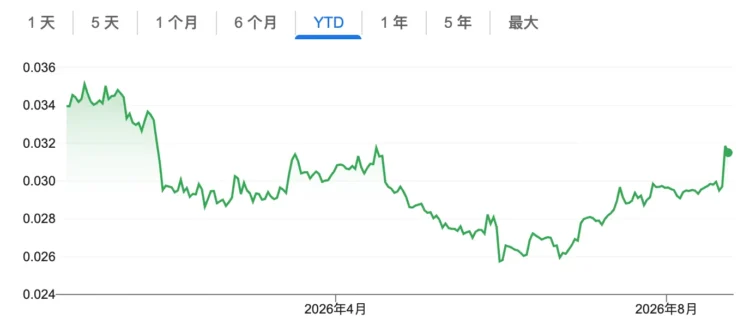
In just one week, ETH recorded an approximate 25% gain, positioning it among the top ten performers by market capitalization within the top 100 crypto assets. This performance notably outpaced Bitcoin during the same period. Furthermore, the ETH/BTC exchange rate has consistently broken its long-term downtrend, now recovering to around 0.031, a level last observed in April.
This robust price recovery has propelled Ethereum’s market capitalization back into the upper echelons of global mainstream assets. Data from 8 Market indicates that Ethereum’s total market cap has soared to approximately $284.3 billion, surpassing Dell and securing the 72nd position globally. This marks a significant turnaround, as only a few months prior, sustained price declines had pushed Ethereum out of the top 100 global assets.
A major catalyst for this rapid rally has been the forced capitulation of short sellers. CoinGlass data reveals that since August 19, cumulative liquidations of Ethereum contracts have exceeded $1.33 billion, with short positions accounting for a staggering 88.4%. This large-scale short covering has undoubtedly amplified ETH’s upward trajectory, creating a pronounced short squeeze.
Renowned trader Doctor Profit highlighted that Ethereum has decisively breached a critical resistance zone from the bear market phase. For the first time since the bear market’s inception, ETH has reclaimed its crucial “golden line” (weekly EMA50). He views this breakthrough as a pivotal technical signal for ETH, urging investors to “fasten their seatbelts” and warning of further pressure on short positions.
Tom Lee, Chairman of BitMine, noted that the rising ETH/BTC exchange rate signifies a growing market focus on the practical applications of tokenization and AI agents—areas where Ethereum stands to benefit significantly. Historically, the ETH/BTC ratio has often climbed during crypto bull markets as Ethereum’s relative usage increased. Previous drivers included the 2017-2018 ICO wave, the 2020-2021 NFT boom, and the 2025 stablecoin surge. This current cycle’s primary driver, he suggests, will be Wall Street’s on-chain tokenization initiatives. Furthermore, easing financial conditions are expected to provide a supportive tailwind for the broader crypto market.
For BitMine, a prominent Ethereum bull, this recovery marks a long-awaited moment of relief. As of August 16, BitMine, the largest institutional holder of Ethereum, held 5.815 million ETH at an average cost of $3,366. With Ethereum’s rebound, their unrealized loss has narrowed substantially from over $8.5 billion to $5.8 billion.
Institutional Inflow: Ethereum ETFs Outshine Bitcoin
On the capital front, Ethereum spot ETFs are consistently radiating positive signals, indicating robust investor interest.
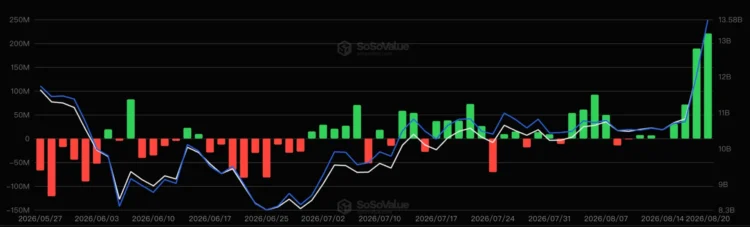
Sosovalue data reveals that Ethereum spot ETFs have registered net inflows for four consecutive trading days, accumulating over $510 million in net inflows this week alone. A single-day net inflow exceeding $220 million on August 20 marked the highest level since October last year. BlackRock’s ETHA continues to be a primary magnet for capital, with its latest single-day net inflow reaching $173 million.
Notably, the capital performance of Ethereum spot ETFs has recently begun to significantly outperform their Bitcoin counterparts. A recent report from DWF Labs highlighted that in June, ETH ETF net outflows constituted 4.65% of the fund’s size, considerably lower than BTC ETF’s 8.09%. By July, ETH ETFs shifted to net inflows, representing 3.19% of the fund’s size, while BTC ETFs recorded only 0.34% – a striking 9.4 times difference.
Institutional allocation strategies are also evolving. DWF Labs observed that Wall Street banks substantially increased their ETH exposure in Q2, with growth rates significantly surpassing BTC. For instance, Morgan Stanley’s BTC exposure rose by 3.7% quarter-over-quarter, while its ETH exposure surged by 18.6%. JPMorgan Chase saw a 12.2% increase in BTC exposure and a remarkable 67.3% jump in ETH exposure.
Furthermore, numerous institutions are actively increasing their positions in Ethereum ETFs, defying previous trends. 13F filings show that Bank of America’s holdings in ETHA expanded from approximately 67,500 shares to about 1.98 million shares, a nearly 29-fold increase, valued at roughly $23.6 million at the end of Q2. Similarly, Italy’s largest bank significantly reduced its holdings in BlackRock Bitcoin ETF IBIT while simultaneously increasing its exposure to BlackRock’s Ethereum offerings.
This fundamental shift in capital structure, rather than mere short-term price fluctuations, warrants closer attention.
In a bid to enhance product appeal, several ETF issuers have recently unveiled new initiatives. BlackRock’s Ethereum ETF ETHA, for example, plans to implement a 1-to-3 reverse stock split on October 6. Fidelity, meanwhile, has applied to integrate staking functionality into its Ethereum ETF, FETH.
The Staking Phenomenon: Growth Amidst Yield Concerns
In stark contrast to Ethereum’s recent price stagnation, its staking volume has consistently demonstrated an upward trajectory.
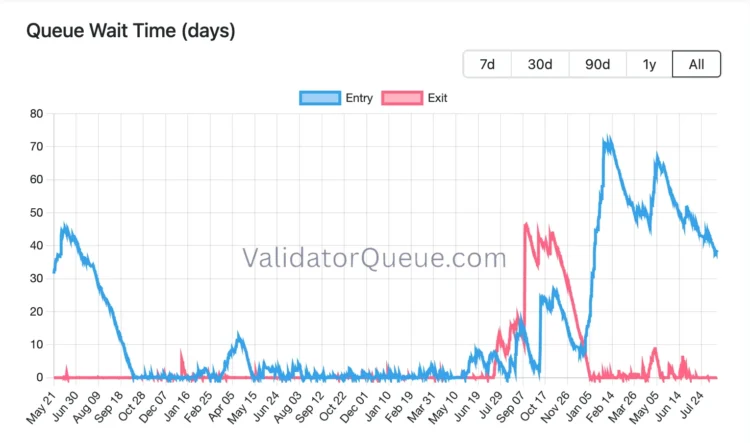
Data from ValidatorQueue indicates that Ethereum’s staking ratio has reached an all-time high, with over 41.1 million ETH currently staked, representing nearly 33.7% of the total supply. Concurrently, the validator exit queue is almost negligible, while approximately 2.21 million ETH are still awaiting entry into the staking queue, with an estimated waiting period exceeding 38 days.
On-chain data further corroborates the market’s long-term holding conviction. Santiment data for the period between May 20 and August 20 shows that large wallets holding over 1,000 ETH collectively decreased their holdings by approximately 1.7 million ETH, accounting for 2.9% of that tier’s total. Conversely, small wallets holding 1 to 10 ETH saw their proportion of holdings increase from 4.38% to 4.52% over the same period, with increases observed on 65 trading days against only 27 days of decline.
However, a reduction in large holder positions doesn’t necessarily imply a sell-off of ETH. Santiment clarifies that only about 300,000 of the outflowing ETH could be traced to smaller wallets; the majority likely entered staking or contract addresses. Furthermore, the ETH balance on exchanges decreased from approximately 7.07 million to 6.54 million during this period, suggesting a move off exchanges rather than outright selling.
The sustained growth in staking volume has also prompted discussions within the community. Ethereum researchers Justin Drake and Jerome de Tychey recently introduced EIP-8363, a proposal suggesting that if the Ethereum staking rate reaches 50% of the total supply, new validator rewards at the consensus layer would be gradually reduced to zero via a progressive burning mechanism. This proposal, however, faced opposition from the community.
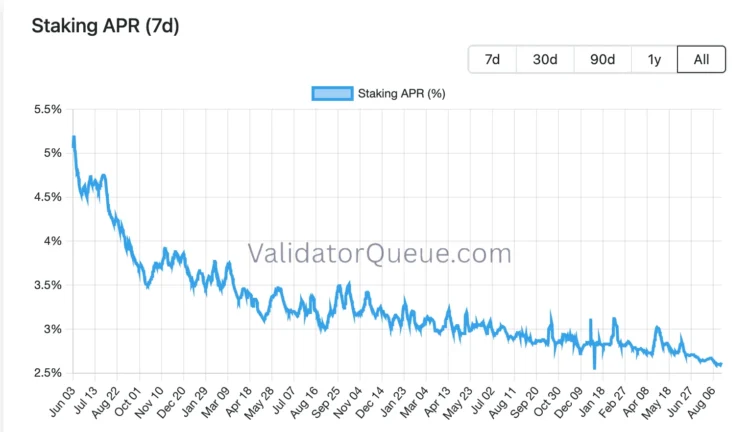
Simultaneously, as the volume of staked ETH and the number of validators continue to climb, staking yields have begun to decline. Data indicates that over the past three months, the ETH staking yield has fallen from a peak of 2.86% to 2.59%, considerably lower than its high of approximately 5.2% three years ago. A continued decline in staking yield could potentially diminish its attractiveness to new capital.
Looking ahead, Ethereum’s next major upgrade, codenamed “Glamsterdam,” is slated for Q4 2026, with EIP-8061 under consideration for inclusion. This proposal aims to eliminate the validator exit cap and accelerate exit processing speeds by approximately fourfold. Such an enhancement would significantly boost the efficiency and flexibility of ETH staking withdrawals. Should these proposals be implemented, stakers would not only earn returns but also gain greater agility in managing their capital liquidity. For institutional investors, improved exit efficiency translates to lower liquidity risk, potentially further incentivizing their participation in staking.
In conclusion, Ethereum’s current rally is underpinned by a robust confluence of positive market sentiment, substantial capital inflows, and strengthening fundamental indicators. However, whether this momentum translates into a sustained long-term recovery will ultimately depend on continued fundamental development and the test of time.
(The above content is an excerpt and reproduction authorized by our partner PANews. Original Link)
Disclaimer: This article is for market information purposes only. All content and views are for reference only and do not constitute investment advice. They do not represent the views and positions of BlockTempo. Investors should make their own decisions and transactions. The author and BlockTempo will not bear any responsibility for direct or indirect losses resulting from investor transactions.